Tools
Before starting to explore a series of lab assignments, please make sure that you have followed the environment setup described below.
Our labs are designed based on Ubuntu 18.04 LTS. We recommend you to stick to this ubuntu version unless you might face some configuration issues as we’re going to provide several scripts during the labs. After finishing early lab phases, you may wish to use QEMU, an x86 emulator for easier executing and debugging process instead of using real raspberry pi board.
This page has the information you’ll need to download and install. This class assumes familiarity with Unix commands throughout.
Ubuntu 18.04 LTS
If you’re not using Ubuntu 18.04 on your laptop, one of simple solutions is using a virtual machine. Or it is also fine if you want to partition your boot disk and install Ubuntu on a secondary partition.
Install Virtual Machine
Our recommeded way of setting up your virtual machine is to use Vagrant with VirtualBox, but you can also choose to use VirtualBox only.
Use Vagrant and Virtualbox
Download and install Virtualbox
(Windows) Turn off Hyper-V in “Turn Windows features on or off”
Download and install the 6.0 version of virtualbox
Vagrant doesn’t work with the latest 6.1 version of virtualbox. To use 6.1 version, see this
(Windows) Enable VirtualBox USB Support when installing.
Download and install the Extension Pack in the same page (for USB connection inside VM)
Download and install the latest 2.2.6 version of Vagrant
Add guest OS and run the VM
# add 32-bit VM
[host] $ vagrant box add ubuntu/bionic64

# Access the VM
[host] $ mkdir cs3210
[host] $ cd cs3210
[host] $ vagrant init ubuntu/bionic64
[host] $ vagrant up
[host] $ vagrant ssh
Use VirtualBox Only
It is optional to use vagrant for our labs. You can use virtualbox only. - If you decide to use virtualbox only,
Follow the previous guide and install VirtualBox.
Download Ubuntu 18.04 LTS desktop image here.
Start up your virtualization platform and create a new (64-bit) virtual machine. Use the downloaded Ubuntu image as a boot disk.
To change the amount of memory on the VM
The default setting for guest machines’ memory is 1GB that might cause error while executing QEMU. You can uncomment and modify Vagrantfile as follows to change the memory size. Or you can use GUI of virtualbox setting.
config.vm.provider "virtualbox" do |vb|
    vb.memory = "2048"
end
If you can’t see your SD card in VM
Make sure VirtualBox Extension Pack is installed.
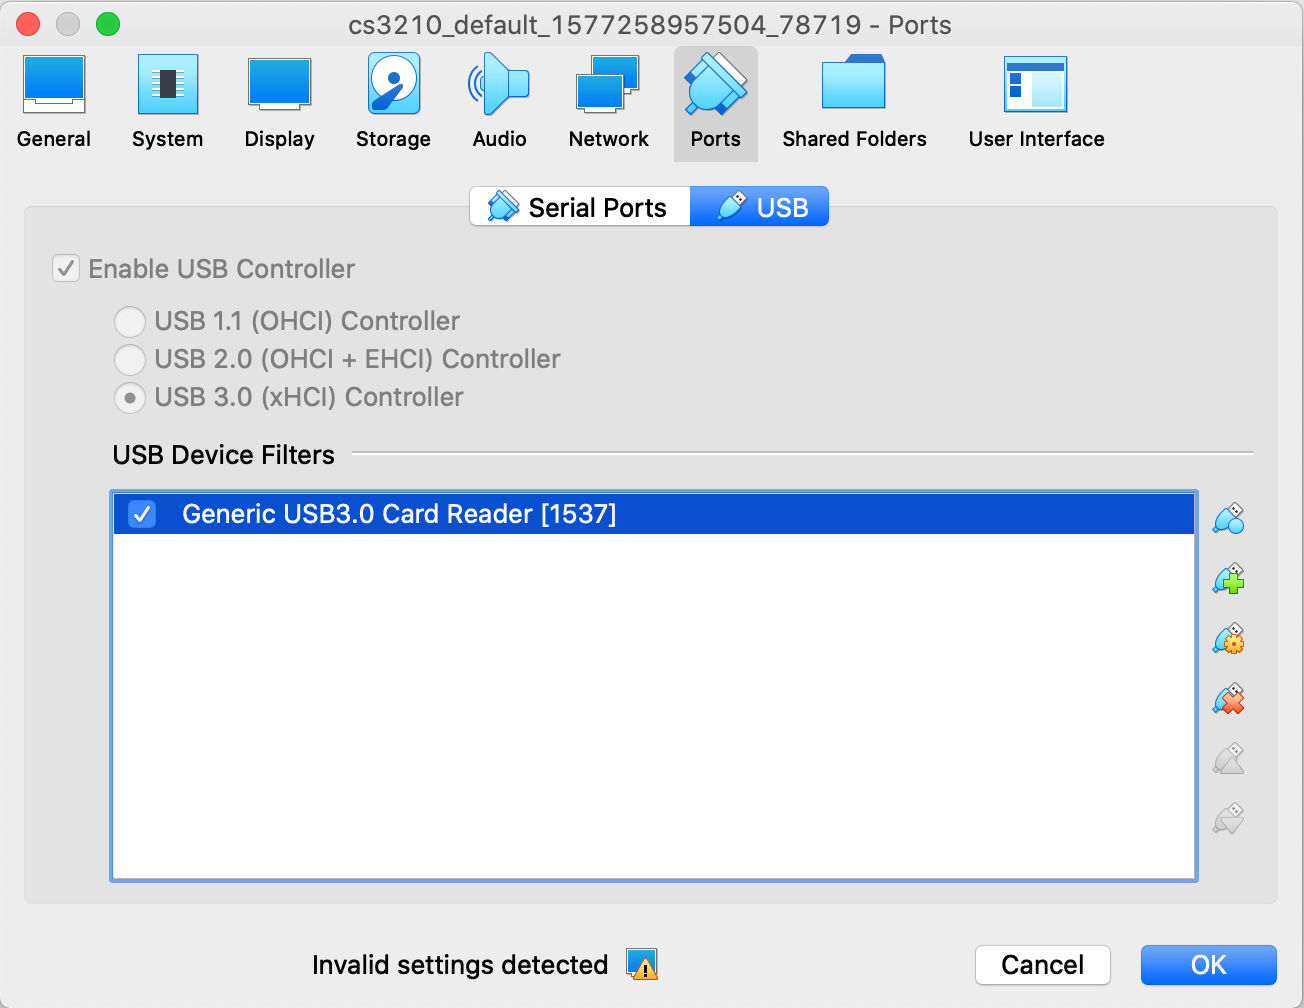
Enable USB port in virtual box setting
Use
lsblkcommand to view all available block devices[VM] $ lsblk NAME MAJ:MIN RM SIZE RO TYPE MOUNTPOINT sda 8:0 0 10G 0 disk └─sda1 8:1 0 10G 0 part / sdb 8:48 1 14.7G 0 disk ├─sdb1 8:49 1 43.9M 0 part └─sdb2 8:50 1 14.6G 0 part
Mount your SD card
[VM] $ sudo mkdir /mnt/sdcard
[VM] $ sudo mount /dev/sdb1 /mnt/sdcard
[VM] $ lsblk
      NAME   MAJ:MIN RM  SIZE RO TYPE MOUNTPOINT
      sda      8:0    0   10G  0 disk
      └─sda1   8:1    0   10G  0 part /
      sdb      8:48   1 14.7G  0 disk
      ├─sdb1   8:49   1 43.9M  0 part /mnt/sdcard
      └─sdb2   8:50   1 14.6G  0 part
You can unmount your SD card with
umountcommand[VM] $ sudo umount /dev/sdb1
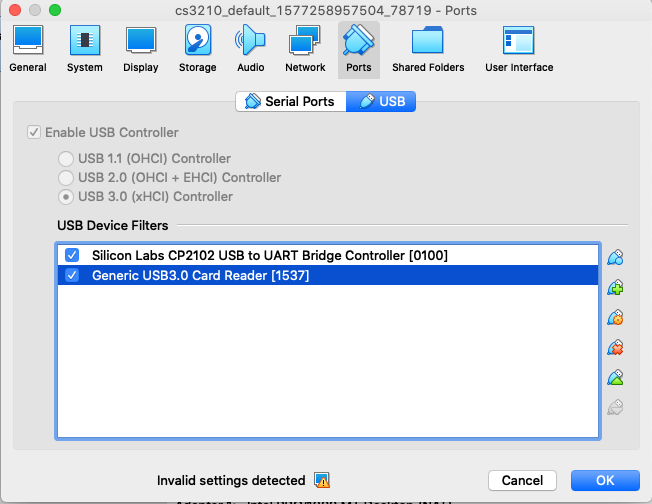
To enable CP2102 connection
To communicate with your pi through serial, you need to screen into proper tty file. On Linux, this will likely be
/dev/ttyUSB0. Please follow these steps if you fail to find this tty file in your guest machine even if you connect your CP2102 module into a USB slot on your machine.
Make sure VirtualBox Extension Pack is installed.
Enable USB port in virtual box setting. You need to plug your pi to do so.
Unplug your pi and start VM.
Plug your pi, type
dmesgin terminal. You’ll see following lines if your CP2102 is enabled.[ 355.847400] usb 1-1: new full-speed USB device number 3 using xhci_hcd [ 356.131082] usb 1-1: New USB device found, idVendor=10c4, idProduct=ea60 [ 356.131083] usb 1-1: New USB device strings: Mfr=1, Product=2, SerialNumber=3 [ 356.131084] usb 1-1: Product: CP2102 USB to UART Bridge Controller [ 356.131085] usb 1-1: Manufacturer: Silicon Labs [ 356.131086] usb 1-1: SerialNumber: 0001 [ 356.132889] cp210x 1-1:1.0: cp210x converter detected [ 356.136205] usb 1-1: cp210x converter now attached to ttyUSB0
If you can’t see the last 2 lines (
cp210x converter now attached to ttyUSBx), check whether your VM hasUSB serialdriver. If all of the above lines were prinited, you can ignore this step.[VM] $ ls /lib/modules/"$(uname -r)"/kernel/drivers/usb/serial/cp210x.ko /lib/modules/4.15.0-72-generic/kernel/drivers/usb/serial/cp210x.ko # if you don't have above module, install additional package [VM] $ sudo apt-get install linux-image-extra-virtual # re-check, and you should see cp210x converter now attached to tty. [VM] $ dmesg
If everything worked well, you should see a new file in
/devwith the name you seen above. You may wish to record the tty path in the last line. In this case, it’s/dev/ttyUSB0. You’ll be referring to it a lot in the future.
Setting up your Environment
Once you have Ubuntu 18.04 up and running, initialize your environment for this course:
# install git
$ sudo apt-get install git

# clone the course repository
$ git clone git://allspark.gtisc.gatech.edu/cs3210-rustos-pub --origin skeleton rustos
Cloning into rustos...
$ cd rustos

# fetch the files for lab0
$ git fetch
$ git merge skeleton/lab0
Please make sure to run setup.sh first which will check and install all dependencies to build qemu as well as selecting the right Rust version to use during our labs.
# setup the environment
$ bin/setup.sh
QEMU Emulator
QEMU (manual) is a modern and fast PC emulator.
We are providing a pre-built QEMU binary to emulate raspberry pi 3+ board as /bin/qemu-system-aarch64.
Tool Guide
Familiarity with your environment is crucial for productive development and debugging. Don’t take our word for it, though. Read the GDB and QEMU manuals. These are powerful tools that are worth knowing how to use.
Note
- Debugging tips:
- Reference:
Debugging tips
Kernel
GDB is your friend. Use the qemu-gdb target (or its qemu-gdb-nox variant) to make QEMU wait for GDB to attach. See the GDB reference below for some commands that are useful when debugging kernels.
If you’re getting unexpected interrupts, exceptions, or triple faults, you can ask QEMU to generate a detailed log of interrupts using the -d argument.
To debug virtual memory issues, try the QEMU monitor commands info mem (for a high-level overview) or info pg (for lots of detail). Note that these commands only display the current page table.
(Lab 4+) To debug multiple CPUs, use GDB’s thread-related commands like thread and info threads.
User environments (lab 3+)
GDB also lets you debug user environments, but there are a few things you need to watch out for, since GDB doesn’t know that there’s a distinction between multiple user environments, or between user and kernel.
You can symbolically debug user code, just like you can kernel code, but
you have to tell GDB which symbol table to use with the
symbol-file command, since it can only use one
symbol table at a time. The provided .gdbinit loads the kernel
symbol table, obj/kern/kernel. The symbol table for a user
environment is in its ELF binary, so you can load it using symbol-file
obj/user/name. Don’t load symbols from any .o files, as those
haven’t been relocated by the linker (libraries are statically linked
into JOS user binaries, so those symbols are already included in each
user binary). Make sure you get the right user binary; library
functions will be linked at different EIPs in different binaries and GDB
won’t know any better!
(Lab 4+) Since GDB is attached to the virtual machine as a whole, it sees clock interrupts as just another control transfer. This makes it basically impossible to step through user code because a clock interrupt is virtually guaranteed the moment you let the VM run again. The stepi command works because it suppresses interrupts, but it only steps one assembly instruction. Breakpoints generally work, but watch out because you can hit the same EIP in a different environment (indeed, a different binary altogether!).
Debugging Raspberry Pi board
To debug a Raspberry Pi 3B+ board, we need a special device called J-Link to use JTAG signal. Here is instructions how to connect and setup J-Link for Raspberry Pi. If you want to use the device, please come to the office during the office hour with your Raspberry Pi 3B+ board and CP2102 USB module.
Connections
Let’s start with physical wiring. You need Raspberry Pi 3B+ board with CP2102 USB module, j-link EDU, and 8 jumper cables.
Here is the connection table describing how to connect your RPi with J-Link.
JTAG-20 Physical Pin
JTAG Signal
RPi GPIO #
ALT mode
RPi Physical Pin
1
VTref
N/A
N/A
1 (3.3V PWR)
3
nTRST
22
ALT4
15
5
TDI
26
ALT4
37
7
TMS
27
ALT4
13
9
TCK
25
ALT4
22
11
RTCK
23
ALT4
16
13
TDO
24
ALT4
18
4/6/8/10/12
GND
N/A
N/A
6/9/14/20/25/..
The layout of RPi physical pin can be found in Lab 1 page. You can find details of j-link signals and pinout layout in J-Link User Guide page 377. Please note that the pinout figure in page 377 is for the body of a j-link EDU connector itself (where Target arrow is pointing), not for the end of the cable. So when you connect male jumper cables to 1” 20-pin ribbon cable, you need to flip the figure horizontally, reversing left to right. That is, the upper right of the ribbon cable is for 1(VTref).
If you finish connecting all those 8 pins, now we are done with physical wiring.
Enable ALT4 for GPIO 22-27
Below is the code responsible for setting the alternative functions for Gpio 22-27 we are using.
fn setup_jlink() {
    Gpio::new(22).into_alt(Function::Alt4);
    Gpio::new(23).into_alt(Function::Alt4);
    Gpio::new(24).into_alt(Function::Alt4);
    Gpio::new(25).into_alt(Function::Alt4);
    Gpio::new(26).into_alt(Function::Alt4);
    Gpio::new(27).into_alt(Function::Alt4);
}
Otherwise, adding the following line to config.txt will do the same job.
enable_jtag_gpio=1
OpenOCD
OpenOCD is an open on-chip debugger software. Download OpenOCD and install through following command.
$ cd rustos
$ bin/build-openocd.sh
Now you can connect with J-Link and RPi board using OpenOCD.
$ cd rustos
$ openocd -f ext/openocd/tcl/interface/jlink.cfg -f ext/rpi3-debug/rpi3.cfg
To use gdb with openocd, type
target remote localhost:3333within gdb.
Reference
Makefile
Our Makefile includes a number of targets to test and run our OS in various ways.
- make
Build kernel in release mode. The result executable and binary will be located under
build/subdirectory.- make debug
Build Rust libraries or kernel in debug mode.
- make check
Check a local package and all of its dependencies for errors.
- make qemu
Start QEMU with the executable file under
build/subdirectory generated bymakecommand. QEMU will generate a detailed log of assembly code of the guest. To exit QEMU, pressCtrl-a x.- make objdump
Disassemble the executable file generated by
make.- make nm
List all symbols in the executable file generated by
make.- make clean
Clean the directory.
- make install
Install compiled kernel image to SD card.
- make test
Execute all unit and integration tests and build examples of a local package.
GDB
See the GDB manual for a full guide to GDB commands. Here are some particularly useful commands for cs3210, some of which don’t typically come up outside of OS development.
- Ctrl-c
Halt the machine and break in to GDB at the current instruction. If QEMU has multiple virtual CPUs, this halts all of them.
- c (or continue)
Continue execution until the next breakpoint or
Ctrl-c.- si (or stepi)
Execute one machine instruction.
- b function or b file:line (or breakpoint)
Set a breakpoint at the given function or line.
- b *addr (or breakpoint)
Set a breakpoint at the EIP addr.
- set print pretty
Enable pretty-printing of arrays and structs.
- info registers
Print the general purpose registers,
eip,eflags, and the segment selectors. For a much more thorough dump of the machine register state, see QEMU’s owninfo registerscommand.- x/Nx addr
Display a hex dump of N words starting at virtual address addr. If N is omitted, it defaults to 1. addr can be any expression.
- x/Ni addr
Display the N assembly instructions starting at addr. Using
$eipas addr will display the instructions at the current instruction pointer.- symbol-file file
(Lab 3+) Switch to symbol file file. When GDB attaches to QEMU, it has no notion of the process boundaries within the virtual machine, so we have to tell it which symbols to use. By default, we configure GDB to use the kernel symbol file,
obj/kern/kernel. If the machine is running user code, sayhello.c, you can switch to the hello symbol file usingsymbol-file obj/user/hello.
Note
QEMU represents each virtual CPU as a thread in GDB, so you can use all of GDB’s thread-related commands to view or manipulate QEMU’s virtual CPUs.
- thread n
GDB focuses on one thread (i.e., CPU) at a time. This command switches that focus to thread n, numbered from zero.
- info threads
List all threads (i.e., CPUs), including their state (active or halted) and what function they’re in.
QEMU
QEMU includes a built-in monitor that can inspect and modify the machine state in useful ways. To enter the monitor, press Ctrl-a c in the terminal running QEMU. Press Ctrl-a c again to switch back to the serial console.
For a complete reference to the monitor commands, see the QEMU manual. Here are some particularly useful commands:
- xp/Nx paddr
Display a hex dump of N words starting at physical address paddr. If N is omitted, it defaults to 1. This is the physical memory analogue of GDB’s
xcommand.- info registers
Display a full dump of the machine’s internal register state. In particular, this includes the machine’s hidden segment state for the segment selectors and the local, global, and interrupt descriptor tables, plus the task register. This hidden state is the information the virtual CPU read from the GDT/LDT when the segment selector was loaded. Here’s the CS when running in the JOS kernel in lab 1 and the meaning of each field:
CS =0008 10000000 ffffffff 10cf9a00 DPL=0 CS32 [-R-]
CS =0008The visible part of the code selector. We’re using segment 0x8. This also tells us we’re referring to the global descriptor table (0x8&4=0), and our CPL (current privilege level) is 0x8&3=0.
10000000The base of this segment. Linear address = logical address + 0x10000000.
ffffffffThe limit of this segment. Linear addresses above 0xffffffff will result in segment violation exceptions.
10cf9a00The raw flags of this segment, which QEMU helpfully decodes for us in the next few fields.
DPL=0The privilege level of this segment. Only code running with privilege level 0 can load this segment.
CS32This is a 32-bit code segment. Other values include
DSfor data segments (not to be confused with the DS register), andLDTfor local descriptor tables.[-R-]This segment is read-only.
- info mem
Display mapped virtual memory and permissions. For example,
ef7c0000-ef800000 00040000 urw
efbf8000-efc00000 00008000 -rw
tells us that the 0x00040000 bytes of memory from 0xef7c0000 to 0xef800000 are mapped read/write and user-accessible, while the memory from 0xefbf8000 to 0xefc00000 is mapped read/write, but only kernel-accessible.
QEMU also takes some useful command line arguments, which can be passed into the JOS makefile using the QEMUEXTRA variable.
- make QEMUEXTRA=’-d int’ …
Log all interrupts, along with a full register dump, to
qemu.log. You can ignore the first two log entries, “SMM: enter” and “SMM: after RMS”, as these are generated before entering the boot loader. After this, log entries look like4: v=30 e=0000 i=1 cpl=3 IP=001b:00800e2e pc=00800e2e SP=0023:eebfdf28 EAX=00000005 EAX=00000005 EBX=00001002 ECX=00200000 EDX=00000000 ESI=00000805 EDI=00200000 EBP=eebfdf60 ESP=eebfdf28 ...
The first line describes the interrupt. The
4:is just a log record counter.vgives the vector number in hex.egives the error code.i=1indicates that this was produced by anintinstruction (versus a hardware interrupt). The rest of the line should be self-explanatory. See info registers for a description of the register dump that follows.Note: If you’re running a pre-0.15 version of QEMU, the log will be written to
/tmpinstead of the current directory.
Questions or comments regarding cs3210? Send e-mail to the TAs at *cs3210-staff@cc.gatech.edu*.